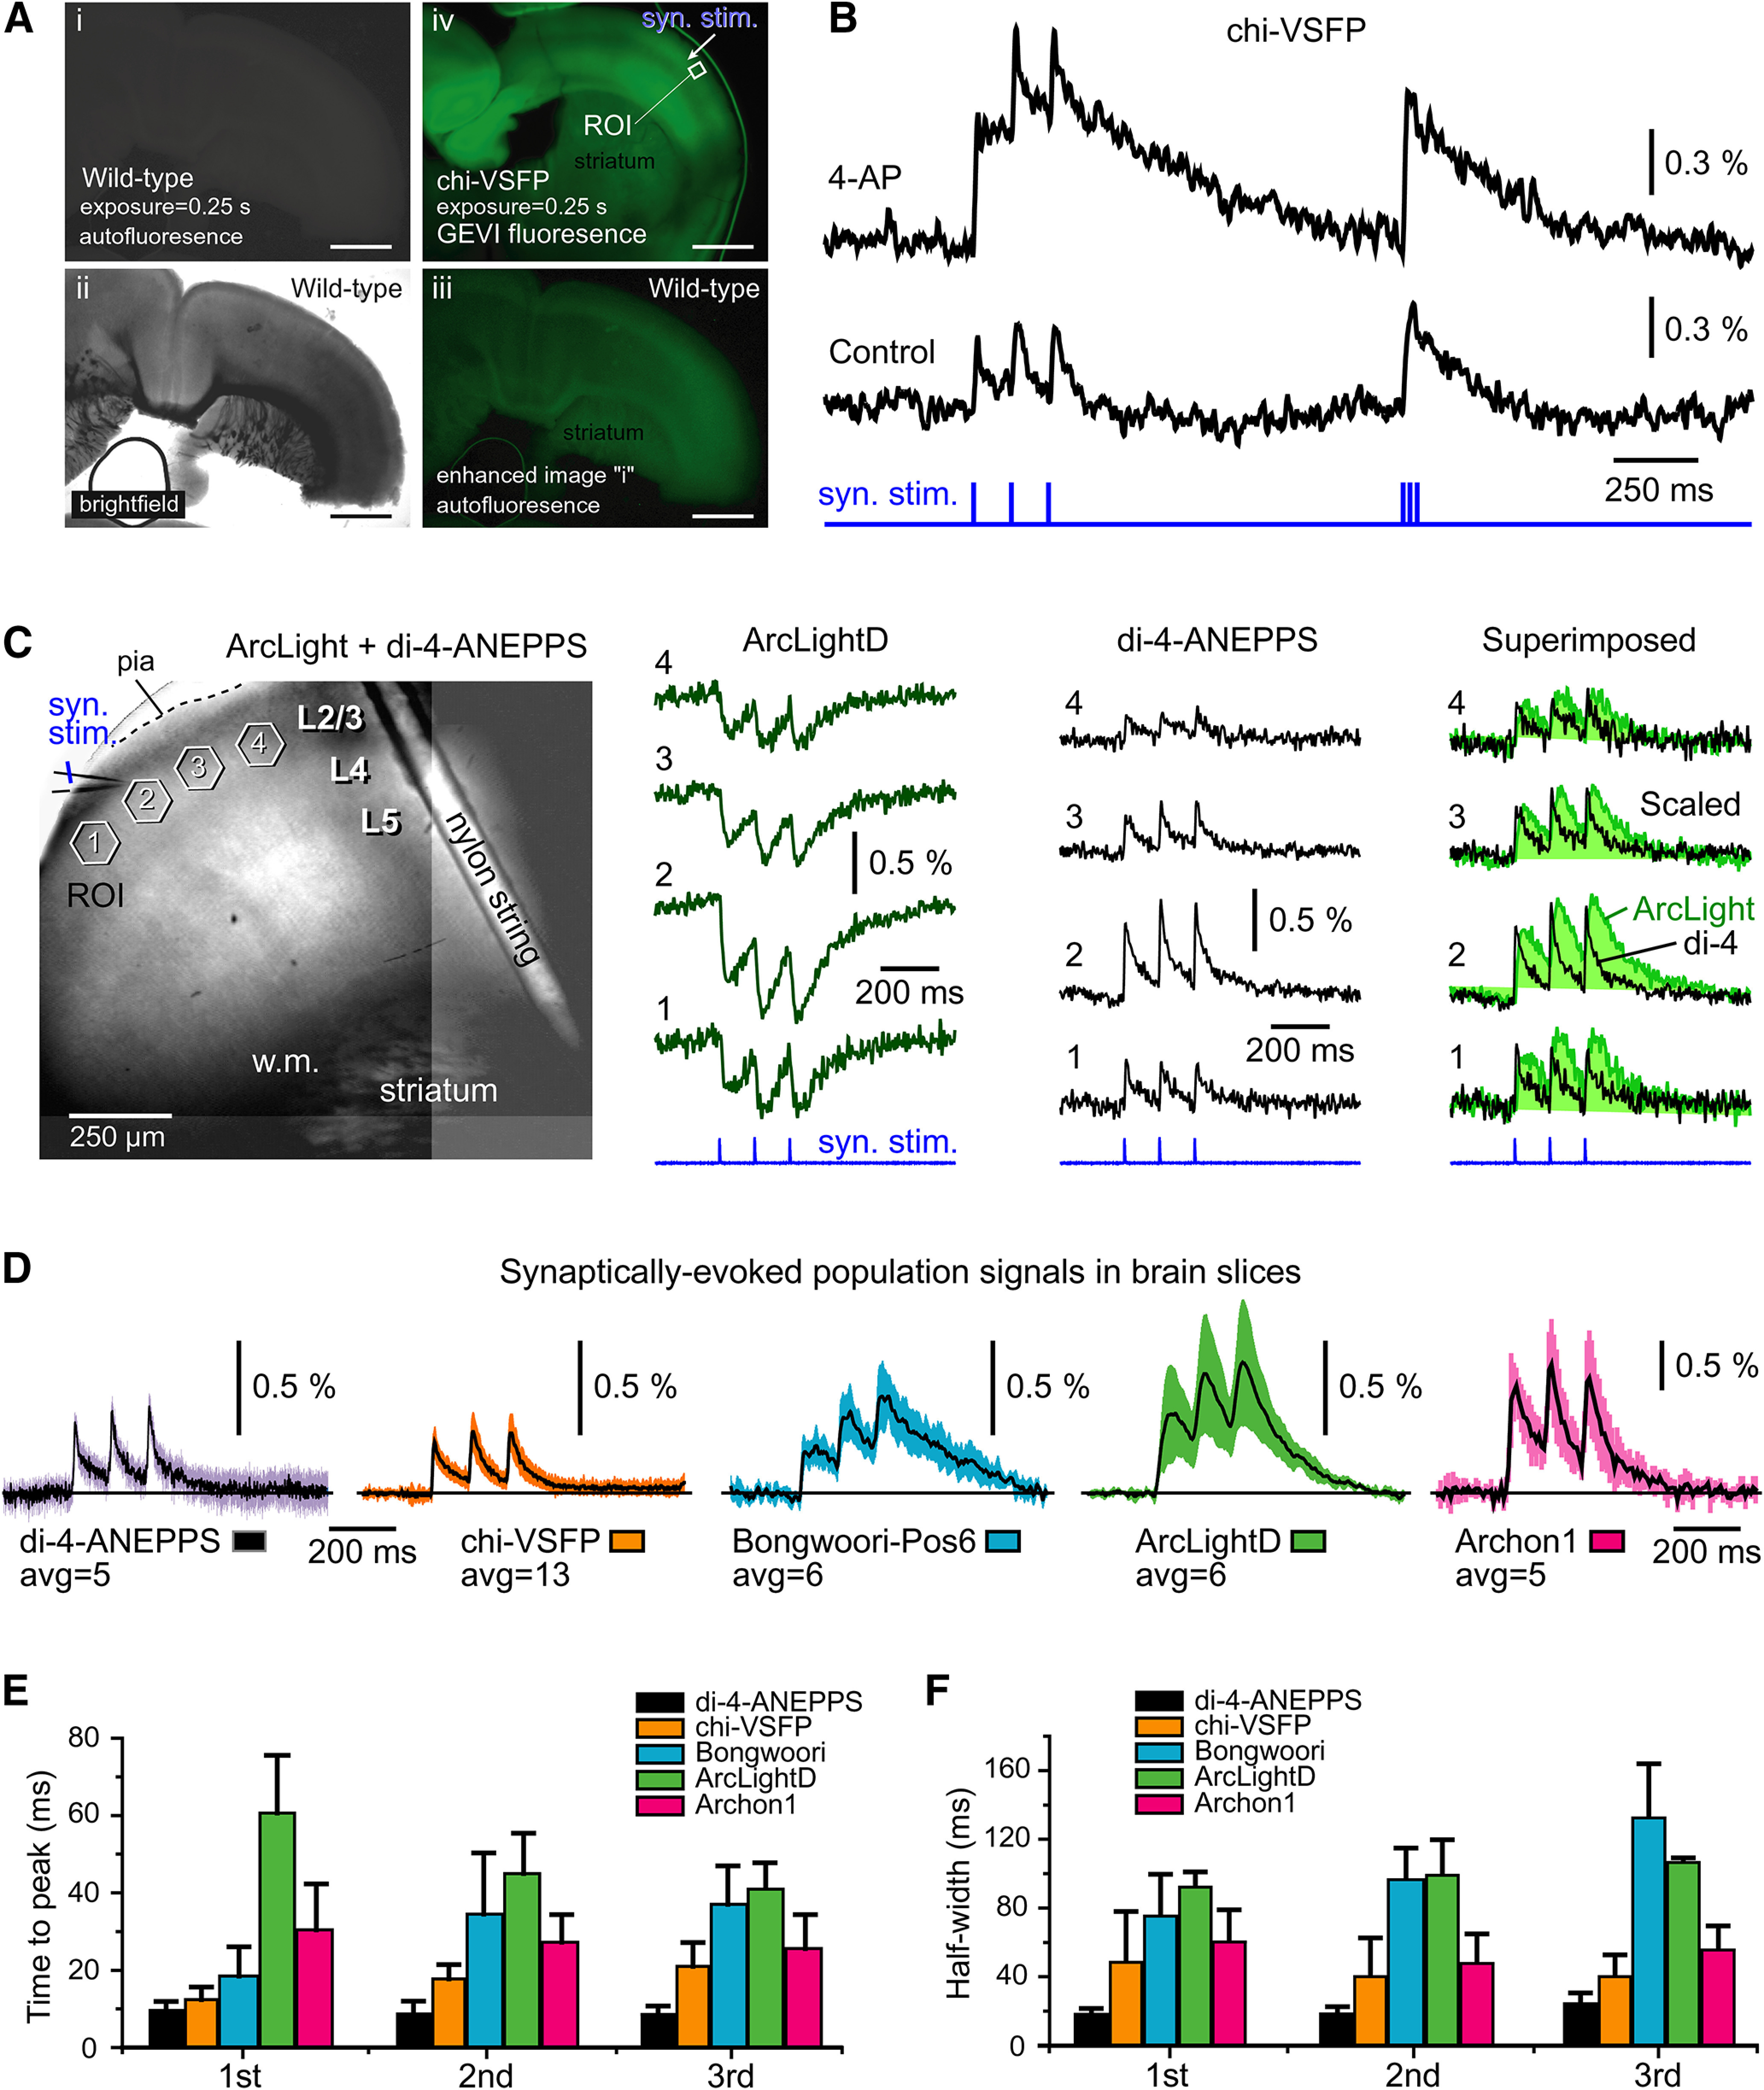
Figure 6.

GEVI imaging of population signals in brain slices. A, Coronal sections through mouse cerebral cortex. Scale bars, 1 mm. i, Wild-type animal; GFP fluorescence channel; exposure duration = 0.25 s. ii, Same as in i except a bright field. iii, Image shown in i is enhanced digitally to reveal autofluorescence pattern in wild-type mouse cortex. iv, Transgenic animal showing expression of a GEVI called chi-VSFP; GFP fluorescence channel; exposure duration = 0.25 s. Imaging settings are identical to those in i. Arrow indicates the position of synaptic stimulation electrode (syn. stim.) in layer 2/3. B, Synaptic stimulation was delivered in layer 2/3. Two optical traces were recorded from the same ROI. Trace Control, Before drug application; trace AP-4, after treatment with K+ channel blocker 4-AP (0.5 mm), the GEVI optical signal exhibits a notable increase in amplitude and duration. C, Brain slice from an AAV-ArcLightD-injected animal was also stained with a voltage-sensitive dye, di-4-ANEPPS. A glass pipette used for stimulation is marked by the syn. stim. label. Optical signals were obtained from four ROIs simultaneously, first in the green channel (ArcLight channel, 480/60, 515, 535/40) and then in the red channel (di-4-ANEPPS channel, 510/60, 570, 600lp). Optical signals are products of temporal averaging (four sweeps). D, Voltage indicators were delivered by the following three methods: (1) transgenic animal (chi-VSFP mouse); (2) intracerebroventricular injections of AAVs at P0 (ArcLight, Bongwoori, and Archon); and (3) incubation of brain slices with a voltage-sensitive dye di-4-ANEPPS. Regardless of the voltage indicator, each brain slice was subjected to synaptic stimulation in layer 2/3, three synaptic shocks at 120 ms interval. Optical signals are products of averaging between slices (n in the range 5–13). E, An average time-to-peak ± SEM for each of the three synaptically evoked voltage transients. F, Same as D, except the quantification was made on duration (half-width) and then averaged between slices (n indicated in C).
