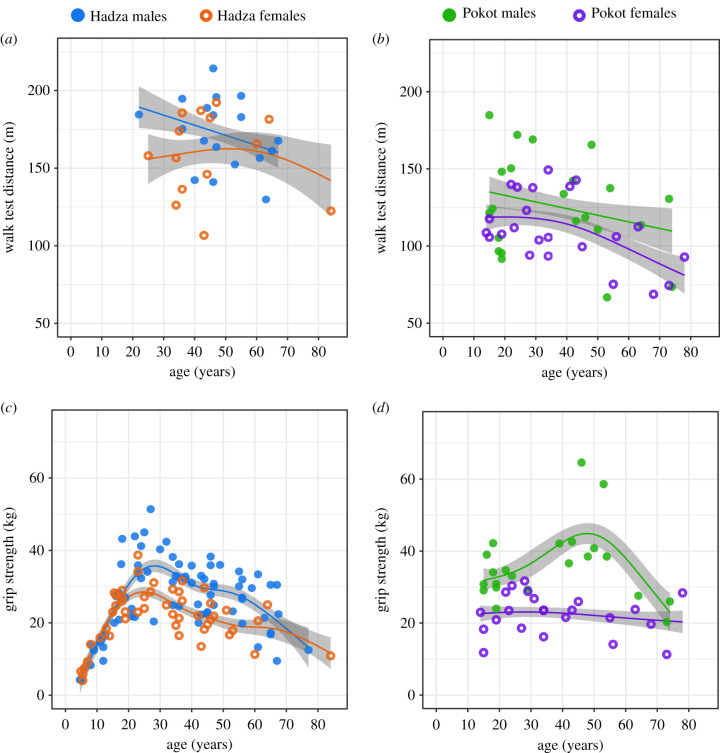
Figure 2.
Walk test performance and grip strength by age in Hadza and Pokot participants. Each data point represents one individual. Filled circles represent male participants and unfilled circles represent female participants. Lines fitting data represent a generalized additive model of the effect of age as a spline function on physical function tests. Shaded region is the 95% confidence interval for the estimated mean performance across age. (a) Walk test for Hadza participants. (b) Walk test for Pokot participants. (c) Grip strength for Hadza participants. (d) Grip strength for Pokot participants.

