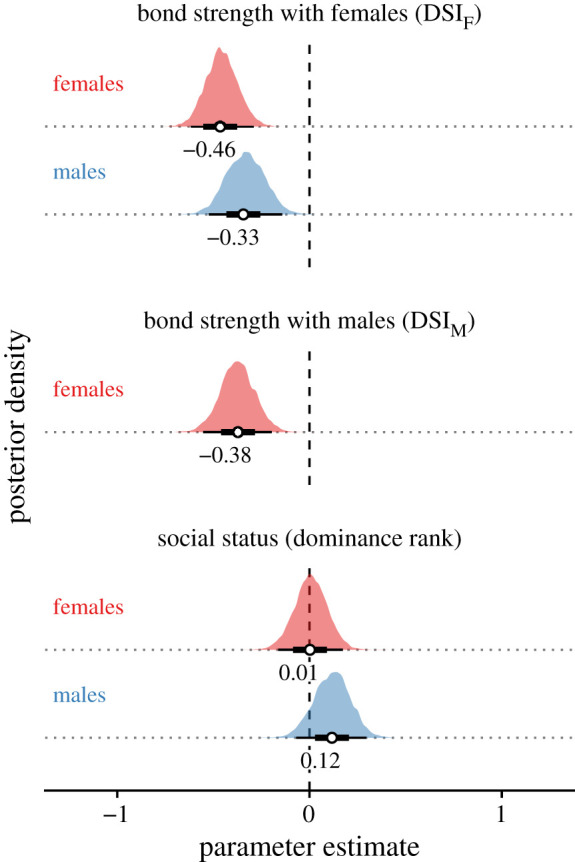
Figure 2.

Posterior densities of the κ parameters that measure the effects of social variables on female and male survival. White points show medians; thick black bars show 68% credible intervals; thinner black bars show 95% credible intervals of the posterior distributions. Negative effect sizes indicate that higher values of a predictor variable were associated with lower mortality risk. (Online version in colour.)
