Figure 3.
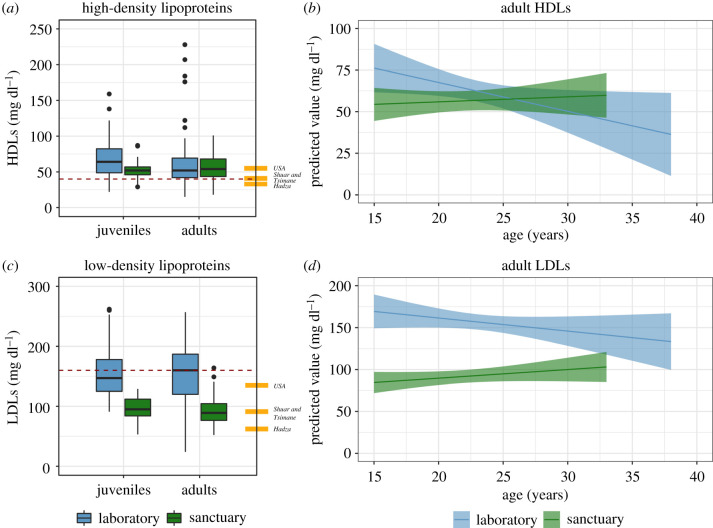
High-density and low-density lipoproteins. (a) Boxplots of HDLs in chimpanzees (adult human reference values: Hadza, 34 mg dl−1; Tsimane, 39 mg dl−1; Shuar, 41 mg dl−1; USA, 55 mg dl−1; dashed line indicates human cardiac risk threshold: under 40 mg dl−1). (b) Estimates of age-related changes in adult HDLs. (c) Boxplots of LDLs in chimpanzees (human reference values: Hadza, 62 mg dl−1; Tsimane, 93 mg dl−1; Shuar, 89 mg dl−1; USA, 135 mg dl−1; dashed line indicates human cardiac risk threshold: over 160 mg dl−1). (d) Estimates of age-related changes in adult LDLs. Boxplots cluster data by age cohort and facility; line indicates group median; whiskers reflect inter-quartile range; dots indicate outliers. In estimate plots, ribbons indicate 95% confidence interval estimates from model accounting for individual identity, sex, age and facility and are truncated at the age range represented for each site. Human values reported in ref. [3]; Hadza, [5]; Tsimane, [4]; Shuar, [14]; USA, [32]. Risk thresholds are from the National Cholesterol Education Program [51], following Raichlen et al. [5]. (Online version in colour.)

