
Figure 1.
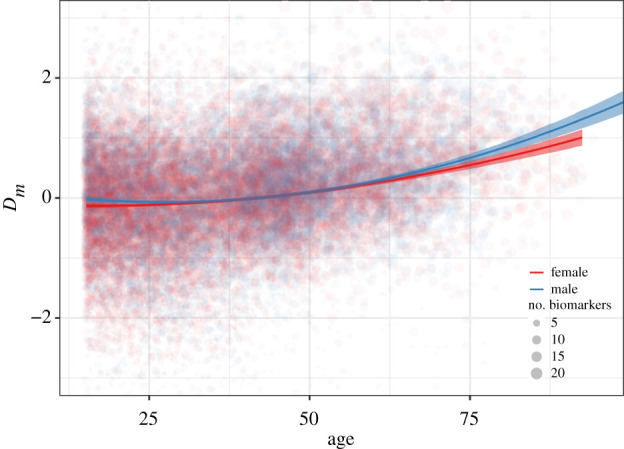
Physiological dysregulation (Dm) as a function of age and sex. Trend lines and confidence intervals are from Model 1 in table 2. Dm was natural log-transformed and standardized. Point size denotes the number of biomarkers measured. The y-axis range is constricted to improve view of the main trends. (Online version in colour.)