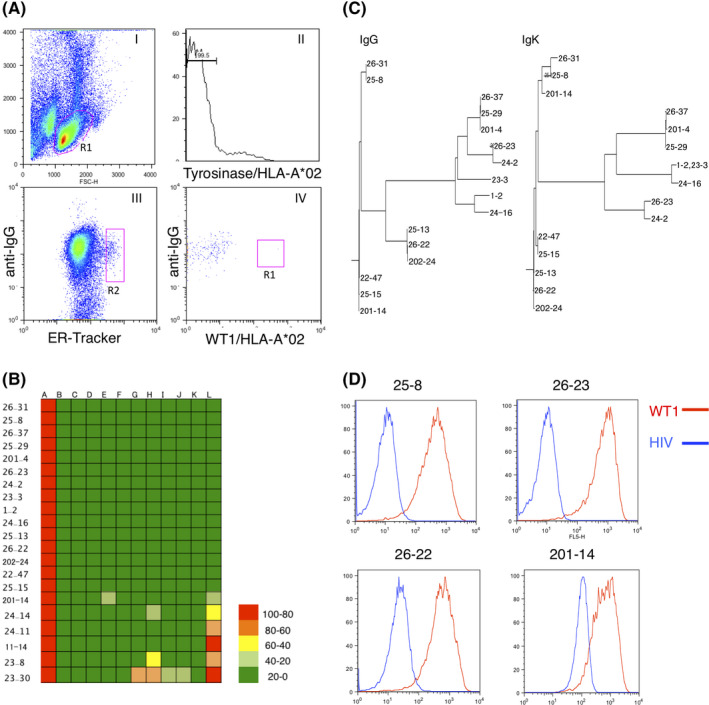
FIGURE 1.

Development of monoclonal antibodies against WT1C/HLA‐A*02. A, FACS gating strategy for the isolation of WT1C/HLA‐A*02‐specific plasma cells (PC). Splenocytes were stained with anti–IgG, ER‐tracker, tyrosinase/HLA‐A*02, and WT1C/HLA‐A*02 antibodies. Plots (I–VI) represent the sequential gating strategy. (I) FSC vs SSC with gate R1 represents lymphocytes. (II) Cells nonspecifically binding to the HLA tetramer were subtracted. (III) The anti–IgG Low ER‐Tracker High fraction was defined as PC. (IV) The WT1C/HLA‐A*02‐specific PC were defined as anti–IgG Medium, ER‐Tracker High, Tyrosinase/HLA‐A*02 low, and WT1C/HLA‐A*02 High (R3 gate). A total of 50 000 events were recorded. B, Binding specificity of antibodies by ELISA with a panel of peptide/HLA‐A*02 monomers. A colored heat map shows the relative immunoreactivity of each antibody clone against the WT1C/HLA‐A*02 monomer compared to that against irrelevant peptide/HLA‐A*02 monomers. A: WT1C, B: Survivin, C: Tyrosinase, D: HCV NS3, E: HIV pol, F: Mart‐1, G: HTLV‐1 Tax, H: WT1126‐134, I: Her2/neu, J: PR1, K: HPV16 E7, and L: MUC1. Signal intensities are color coded as follows: light green (<0%), green (>0%‐25%), yellow (>25‐50), orange (>50%‐75%), and red (>75%). Values are represented as the means of two replicates. C, Phylogenetic analysis of heavy chain variable (VH) and light chain variable (VL) amino acid sequences of WT1C/HLA‐A*02‐specific antibody clones. D, FACS analysis of antibody clones by T2 cells pulsed with peptides. T2 cells pulsed with either WT1C or HIV were stained with the indicated antibody. The binding ability of each antibody was evaluated by the mean fluorescent intensity of stained T2 cells. Representative data from two independent experiments are shown.
