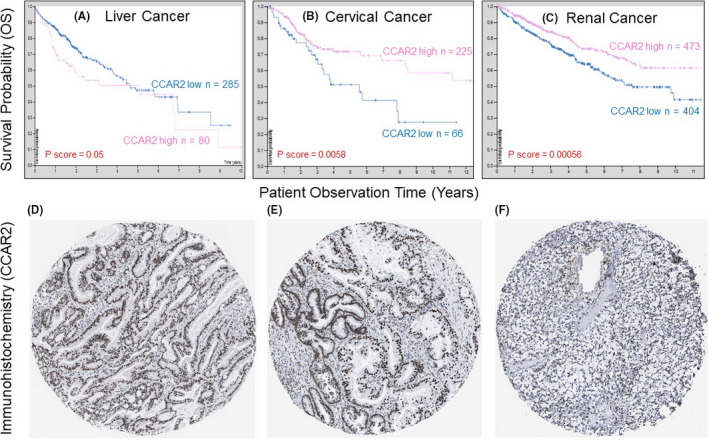
Figure 4.

A‐C, OS in liver, cervical, and renal cancer patients with high vs low CCAR2 mRNA expression. D‐F, immunodetection of nuclear Cell Cycle and Apoptosis Regulator 2 (CCAR2) for the tumor types shown in A‐C; IHC images were obtained from the Human Protein Atlas, see Figure 3 legend
