
Figure 6.
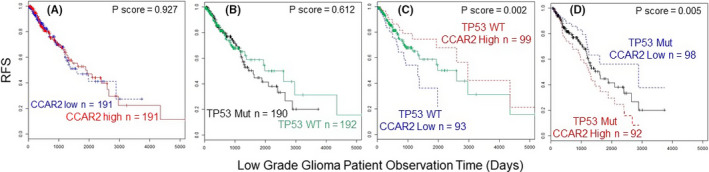
Kaplan‐Meier curves for CCAR2 and TP53 mutation status in glioma. Results from The Cancer Genome Atlas (TCGA) database indicating recurrence‐free survival (RFS), all panels. A, Comparison of CCAR2 high vs CCAR2 low expression; B, comparison of TP53 wild type vs TP53 mutant status; C, wild type TP53 with CCAR2 high vs CCAR2 low expression as a covariate; D, mutant TP53 with CCAR2 high vs CCAR2 low as a covariate. Mut, mutant TP53; WT, wild‐type TP53