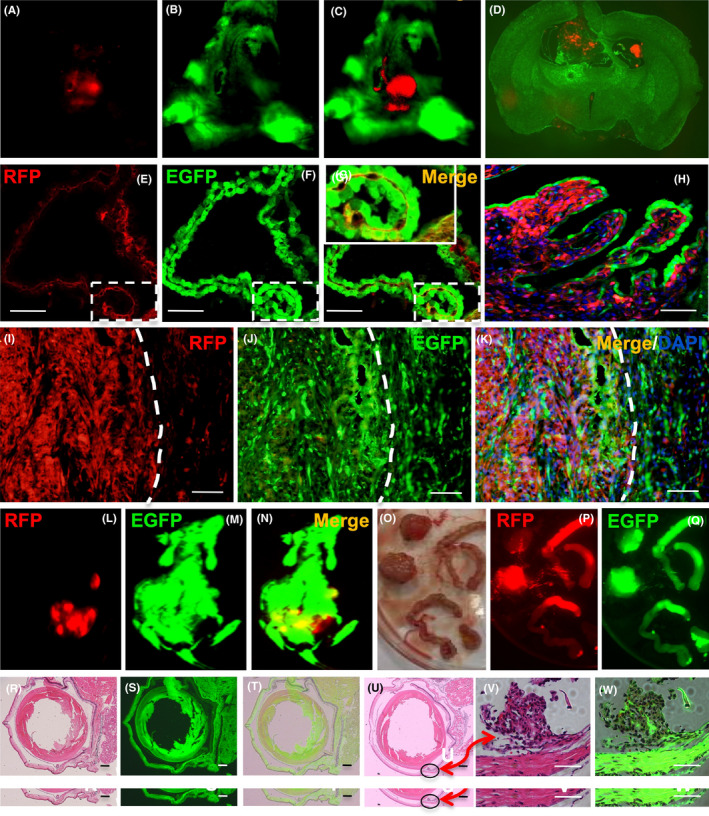
Figure 4.

Dual‐fluorescence tracing intracranial xenograft model of human glioma cell line SU3/RFP in Foxn1nu.B6‐Tg(CAG‐EGFP) mice. A‐C, Under the In‐vivo Imaging System, a red‐colored lesion in the green cerebral hemisphere of the living tumor‐bearing mice can be observed directly; D, Brain tissue biopsy, dissected from tumor‐bearing mouse, showed that xenografts expressing red fluorescence invaded the lateral ventricle of green fluorescent nude mice. E‐G, Tumor cell growth along the choroid plexus. A magnified image of the frame indicated that a portion of cells o–expressed RFP and EGFP, termed “yellow cells”. H, Tumor cells grew along the choroid plexus and gradually spread, in the advanced stage of transplanted tumor. I‐K, Under a confocal microscope, it is easy to observe the tumor microenvironment (TME) of the junction area of the transplanted tumor, where a considerable number of yellow cells that co–expressed red fluorescence protein (RFP) and enhanced green fluorescent protein (EGFP) can be seen. The white dotted line represents the tumor boundary. L‐Q, SU3/RFP in the abdominal cavity formed a huge occupying lesion, and extensive infiltration of the small intestine. R‐W, The orthotopic transplantation model of the 92‐1 cell subretinal space injection of Foxn1nu.B6‐Tg(CAG‐EGFP) mice eye. R, Normal mouse eye H&E staining. S, Normal mouse eye image under fluorescence image. T, The merge image of R and S. U, Tumor cells (black circles) were settled in uvea and surrounding area in H&E staining section, after 3 days of 92‐1 cells injection. V, W, Tumor cells were surrounded by host stroma, which was red under white light and green under fluorescence microscope, respectively. Scale bar = 100 µm
