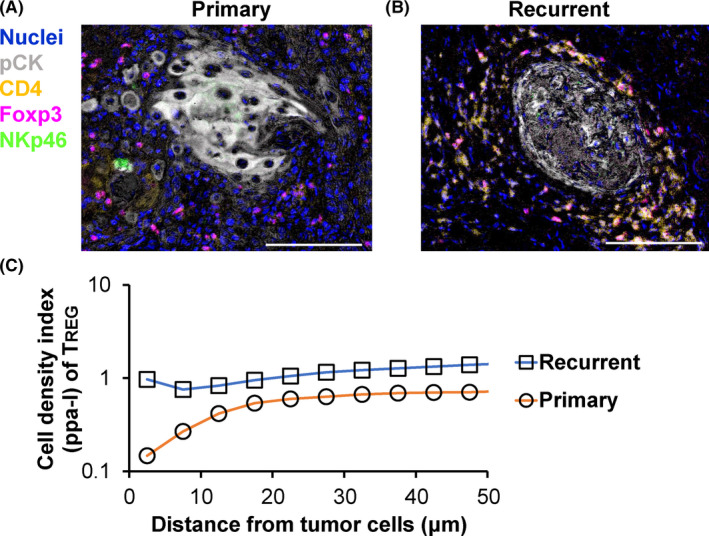
FIGURE 4.

Primary and recurrent tumors exhibit differential cell‐cell spatial relationships between tumor cells and TREG. A, B, Spatial relationships between pCK+ tumor cells and immune cells are compared between new primary (A) and recurrent primary (B) head and neck tumors from the same individual. CD3+CD4+Foxp3+ regulatory T cells (TREG) exhibited short proximity to tumor cell nests at recurrent status. Scale bars, 100 μm. C, Cell‐cell spatial relationships between tumor cells and TREG were quantitatively assessed via pair correlation function analysis. The values were < 1.0, indicating a mutually exclusive distribution between tumor cells and TREG at the primary tumors
