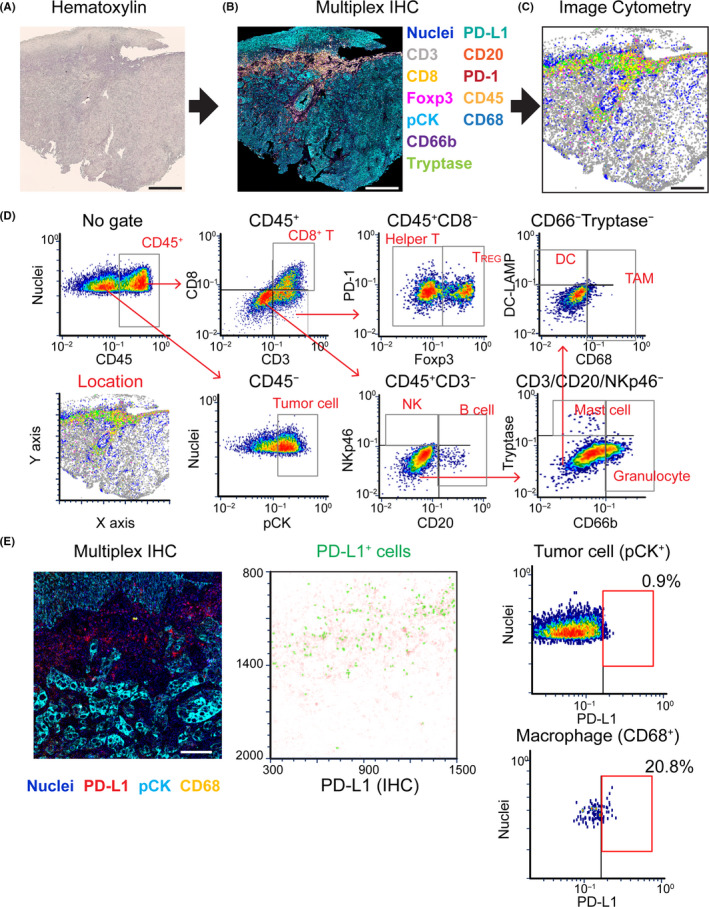
FIGURE 5.

12‐biomarker multiplex immunohistochemistry (IHC) enables quantitative assessment of tumor immune microenvironment with preserved tissue architecture. A, B Images exhibit hematoxylin (A) and 12‐color multiplex IHC images (B) from a single formalin‐fixed paraffin‐embedded section of salivary gland carcinoma tissue. C, Image cytometric analysis enables visualization and quantification of 12+ different biomarkers with preserved location information. Scale bars, 500 μm. D, Gating strategies were applied for lineage identification in cytometric analysis. E, Image cytometry plots (right panels) exhibit PD‐L1 expression on tumor cells (pCK+) and CD68+ macrophages. The corresponding multiplex IHC image (left panel) and location plot (middle) are shown. Scale bar, 100 μm
