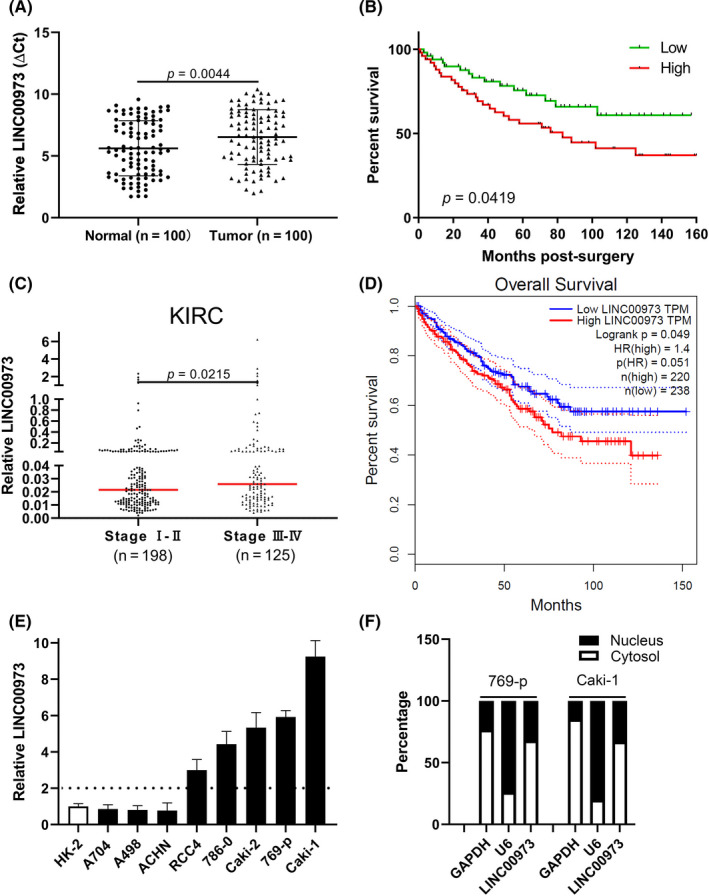
FIGURE 1.

High expression of LINC00973 in clear‐cell renal cell carcinoma (ccRCC). A, Real‐time PCR analysis of relative expression of LINC00973 in ccRCC tumor tissues and paired adjacent normal tissues. B, Kaplan‐Meier survival curve of ccRCC patients with either high or low level of LINC00973. C, Correlation analysis of relative LINC00973 level with tumor stage of ccRCC patients (KIRC) in the publicly available TCGA database. D, Overall survival analysis of KIRC dataset in respect to LINC00973 levels with Gepia (http://gepia.cancer‐pku.cn/). E, Quantitative PCR analysis of relative expression of LINC00973 in panel of ccRCC cell lines including 769‐p, Caki‐1, Caki‐2, A498, A704, ACHN, RCC4, and 786‐0. F, Subcellular localization of LINC00973 was determined by fractionization analysis with GAPDH as a cytosol marker and U6 as a nucleus marker, respectively
