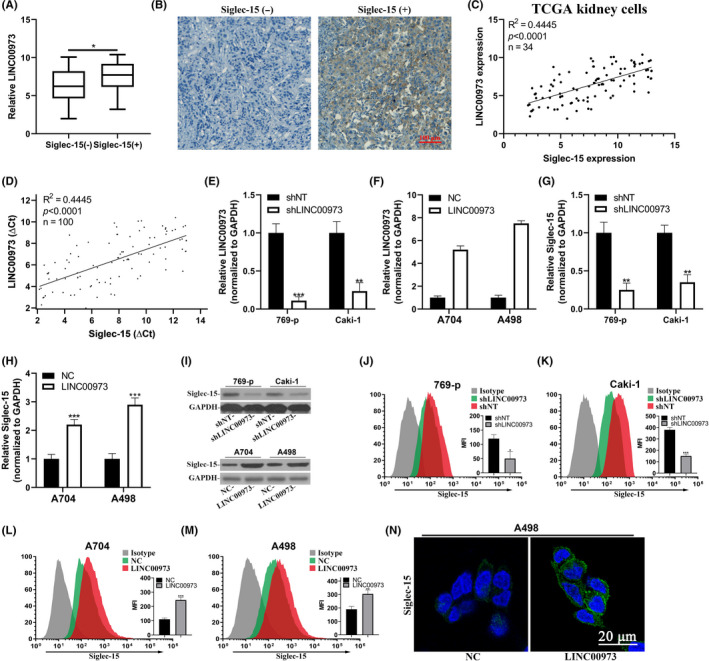
FIGURE 2.

LINC00973 upregulated Siglec‐15 in clear‐cell renal cell carcinoma (ccRCC) cells. (A) Comparison of LINC00973 abundance in Siglec‐15 negative and positive ccRCC tumors. (B) Representative images of Siglec‐15 immunohistochemistry (IHC) staining results. (C) Correlation analysis of endogenous LINC00973 and Siglec‐15 expression in publicly available TCGA kidney cells (n = 34). (D) Correlation analysis of LINC00973 and Siglec‐15 in clinical ccRCC tumor samples (n = 100). (E) Establishment of LINC00973‐knockdown cell lines in 769‐p and Caki‐1 cells was validated by real‐time PCR. (F) Establishment of LINC00973‐overexpressing cell lines in A704 and A498 cells was validated by real‐time PCR. (G) Relative expression of Siglec‐15 transcripts in LINC00973‐deficient 769‐p and Caki‐1 cells. (H). Relative expression of Siglec‐15 transcripts in LINC00973‐proficient A704 and A498 cells. (I) Western blot analysis of Siglec‐15 protein in LINC00973 knockdown or overexpressing cells. Flow cytometry analysis of cell surface Siglec‐15 abundance in response to LINC00973 knockdown in 769‐p (J) and Caki‐1 (K) cells, and LINC00973‐overexpressing in A704 (L) and A498 (M). N. Immunofluorescence staining of cell surface Siglec‐15 of A498 in response to either control (NC) or LINC00973 overexpression
