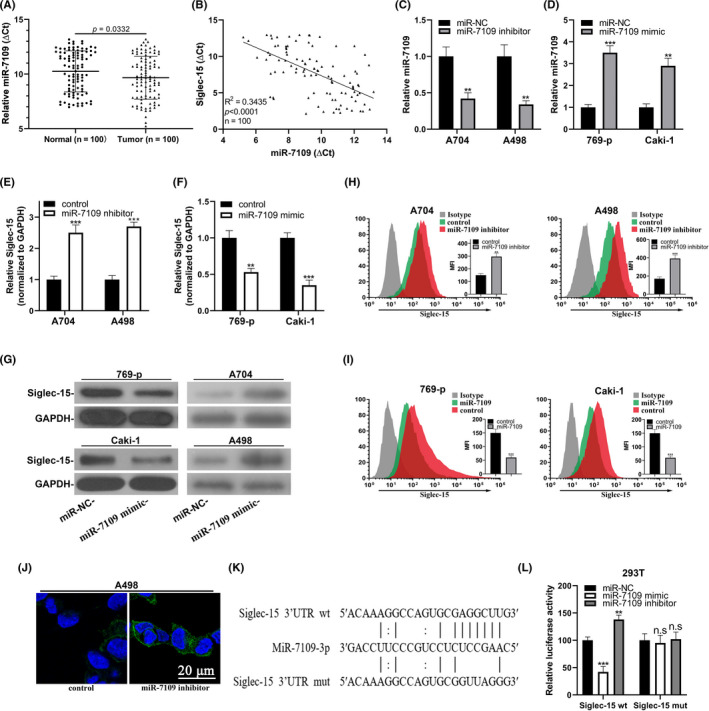
FIGURE 4.

Siglec‐15 was a direct target of miR‐7109 in clear‐cell renal cell carcinoma (ccRCC). (A) Real‐time PCR analysis of miR‐7109 expression in ccRCC tumor samples with paired adjacent normal tissues. (B) Correlation analysis between miR‐7109 and Siglec‐15 in ccRCC tissue samples (n = 100). (C) Change of miR‐7109 expression in both A704 and A498 cells in response to miR‐7109 inhibitor. (D) Change of miR‐7109 expression in both 769‐p and Caki‐1 cells in response to miR‐7109 mimic. (E) Endogenous Siglec‐15 transcripts were quantified in both A704 and A498 cells transfected with either control or miR‐7109 inhibitor. (F) Endogenous Siglec‐15 transcripts were quantified in both 769‐p and Caki‐1 cells transfected with either control or miR‐7109 mimics. (G) Western blot analysis of Siglec‐15 proteins in the same cells as in panel E and F. (H) Flow cytometry analysis of cell surface Siglec‐15 abundance in A704 and A498 cells in response to miR‐7109 inhibitor. (I) Flow cytometry analysis of cell surface Siglec‐15 abundance in 769‐p and Caki‐1 cells in response to miR‐7109 mimics. (J) Immunofluorescence staining of cell surface Siglec‐15 in A498 cells transfected with either control or miR‐7109 inhibitor. (K) Alignment between miR‐7109 seed region and both wild‐type and putative binding site‐mutated Siglec‐15 3ʹUTR. (L) Luciferase reporter analysis of the potential regulatory effects of miR‐7109 on Siglec‐15 in 293T cells, which were transfected with control, miR‐7109 mimics, and miR‐7109 inhibitors, respectively
