
FIGURE 2.
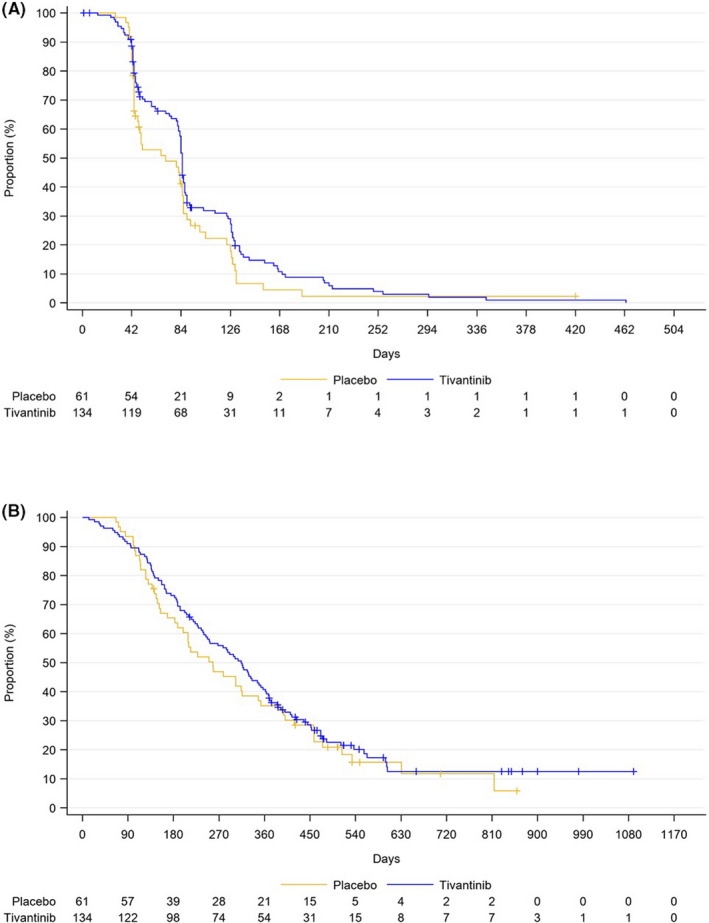
Kaplan‐Meier curves of the intent‐to‐treat (ITT) population in the tivantinib group (blue line) vs the placebo group (yellow line). A, Progression‐free survival (PFS) based on independent radiological committee. B, Overall survival (OS)
Official websites use .gov
A
.gov website belongs to an official
government organization in the United States.
Secure .gov websites use HTTPS
A lock (
) or https:// means you've safely
connected to the .gov website. Share sensitive
information only on official, secure websites.
Kaplan‐Meier curves of the intent‐to‐treat (ITT) population in the tivantinib group (blue line) vs the placebo group (yellow line). A, Progression‐free survival (PFS) based on independent radiological committee. B, Overall survival (OS)