
Figure 4.
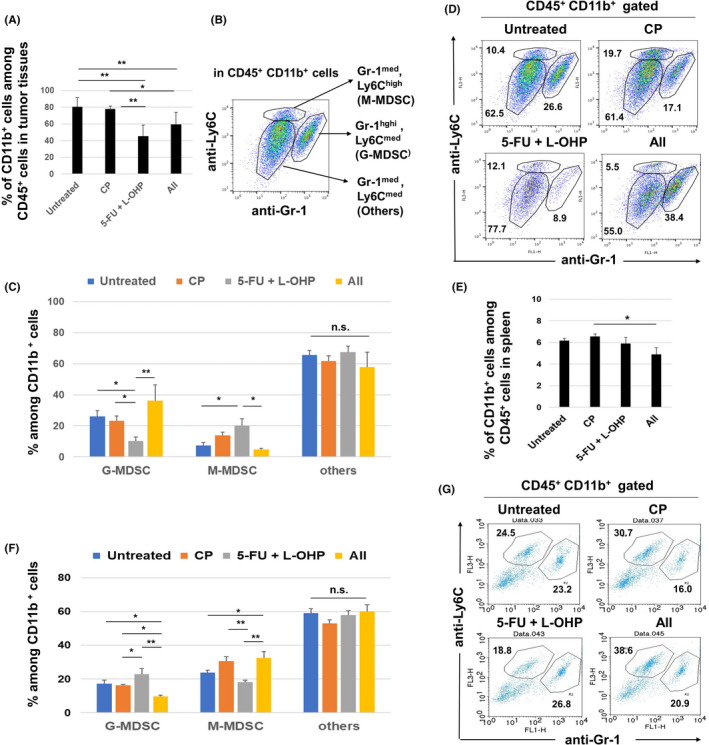
Flow cytometric analysis of MDSCs in CT26‐bearing mice. At 22 days after tumor inoculation (4 days after the second treatment), tumor tissues were harvested and analyzed by flow cytometry. A, Proportion of CD11b+ cells. B, The staining strategy used to discriminate MDSC subsets. C, Percentages of M‐MDSCs, G‐MDSCs, and “others.” The mean ± SEM data of five mice are shown. D, Representative results; numbers are percentages. E, Similarly, the proportion of CD11b+ cells in spleen is shown. F, Percentages of M‐MDSCs, G‐MDSCs, and “others.”. The means ± SEM of four mice are shown. G, Representative results; numbers are percentages. * P < 0.05, ** P < 0.01 (ANOVA). CP, cyclophosphamide; 5‐FU, 5‐fluorouracil; L‐OHP, oxaliplatin; MDSC, myeloid‐derived suppressor cell; n.s., not significant