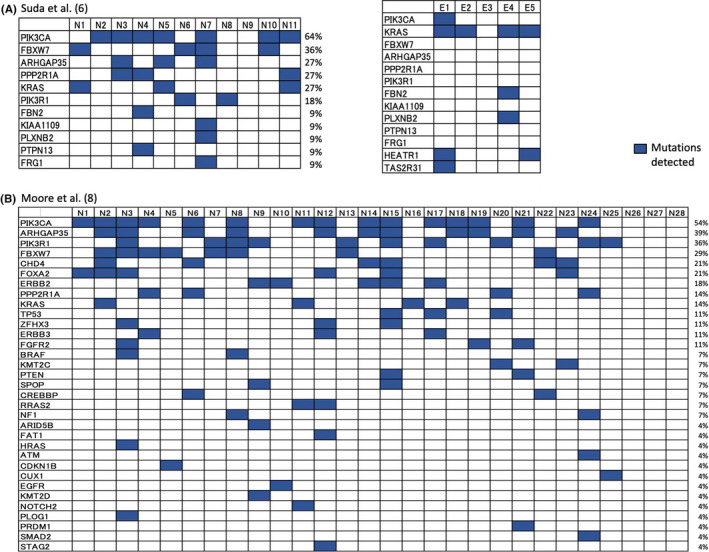
FIGURE 2.

Oncoplot of driver mutations and distribution across individual patients by whole‐exome sequencing. The results of the references 6 (A) and 8 (B) are summarized, with some alterations. The listed genes (shown in the vertical columns) differed between the 2 studies; patient numbers are shown in the horizontal rows. N and E indicate normal endometrial and endometriosis samples, respectively. Paired samples were analyzed in 5 patients (patients 1 to 5) (A). The frequency (%) of patients with mutations are shown beside the plot for each gene. (Adapted from alterations and permission from references 6 and 8 )
