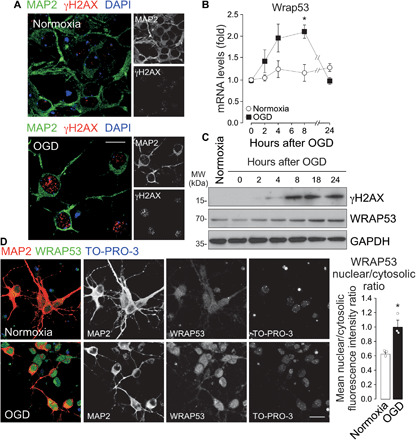
Fig. 1. OGD increased DNA DSBs and WRAP53 expression, which translocates to the nucleus in neurons.

Neurons were subjected to normoxic (normoxia) or OGD conditions for 3 hours and were further incubated in culture medium for 8 hours or indicated time periods. (A) Representative image of cortical neurons stained with MAP2 (neuronal marker), γH2AX (DSB marker), and 4′,6-diamidino-2-phenylindole (DAPI; nuclear marker). Scale bar, 15 μm. (B) Time course of Wrap53 mRNA levels as quantified by real-time qPCR. The error bars are standard error deviation from three different neuronal cultures (*P < 0.05 versus normoxia; two-way ANOVA followed by the Bonferroni post hoc test). (C) Time course of WRAP53 and γH2AX expression levels as detected by Western blotting. Glyceraldehyde-3-phosphate dehydrogenase (GAPDH) was probed as loading control. Representative blots are shown. Protein abundance quantification from three different neuronal cultures is shown in fig S1A. MW, molecular weight. (D) Representative image of cortical neurons stained with MAP2, WRAP53, and TO-PRO-3 (nuclear marker). Scale bar, 25 μm. The nuclear to cytosolic fluorescence intensity ratio of WRAP53 staining was quantified in around 145 neurons (45 to 50 neurons per culture). The error bars are standard error deviation from three different neuronal cultures (*P < 0.05 versus normoxia; Student’s t test).
