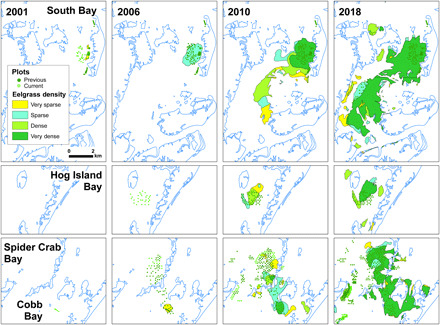
Fig. 2. Seagrass cover in the four bays for four time periods: 2001, 2006, 2010, and 2018.

Cover estimates (very sparse, 1 to 10%; sparse, 11 to 40%; moderate, 41 to 70%; dense, 70 to 100%) indicated by color in each polygon. Small squares in each box represent restoration plots (light green are plots done that year; dark green are plots done in previous years).
