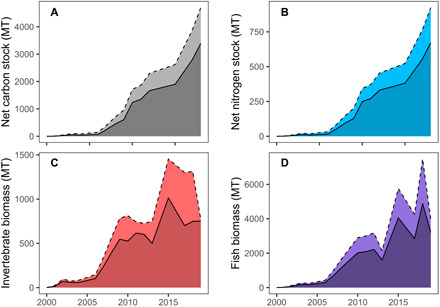
Fig. 5. Ecosystem services associated with the restoration of eelgrass over time. Mean (solid lines) and 95% confidence intervals (dotted lines) over time (mT = metric tons).

(A) Net sediment carbon stocks. (B) Net sediment nitrogen stocks (net stock = seagrass sediment stock − unvegetated sediment stock). For sediment nutrient stocks, measurements were taken in beds of varying ages and these values were matched with the corresponding year since the beginning of the restoration. (C) Total invertebrates. (D) Total fish biomass. For faunal communities, data were collected in various years, and averages/standard deviations were used to interpolate values for years in which no data were available. Both measurements were expressed per unit area and extrapolated to the total bed area for each year.
