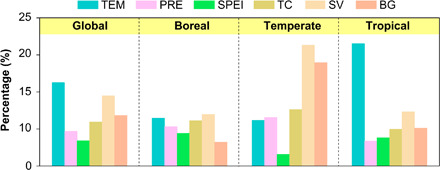
Fig. 4. Proportion of colocated annual Rs change and each of the six driving factors at global and regional scales from 2000 to 2014.

The plot represents the percentage of the areas with both significant climate (or land-cover) change and significant annual Rs change to the areas with significant annual Rs change. Climate factors include TEM, PRE, and SPEI. Land-cover factors include TC cover, SV cover, and BG cover. This plot indicates that the significantly changed Rs in temperate and boreal regions was more commonly located in areas with significant changes in SV cover than in areas with significant climate change.
