
Fig. 6. Spatial patterns of partial correlation coefficient between annual Rs and its six driving factors from 2000 to 2014.
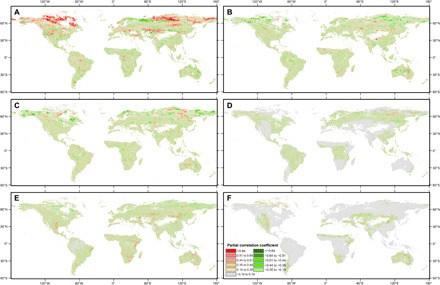
Partial correlation coefficient (R) between detrended annual Rs and detrended driving factors are shown in (A) Rs and TEM, (B) Rs and PRE, (C) Rs and SPEI, (D) Rs and TC cover, (E) Rs and SV cover, and (F) Rs and BG cover. R = ±0.64, R = ±0.51, R = ±0.44, R = ±0.35, and R = ±0.19 correspond to the 0.01, 0.05, 0.1, 0.2, and 0.5 significance levels, respectively. To reduce the effects from the data acquisition error in the land-cover data, only the per-pixel percent cover of TC, SV, and BG greater than 25% (61) was used to conduct the partial correlation analysis.