. 2020 Sep 21;9:e56954. doi: 10.7554/eLife.56954

Figure 2. Low expression of voltage-gated Na+ and Ca2+ channels in APL.

(A) Expression levels of GABAergic markers and various Na+, Ca2+, K+, Cl- and other channels, in APL compared to non-APL mushroom body neurons, normalized to the mean of non-APL neurons. Box plots show the distribution of expression levels in non-APL MB neurons (whiskers show full range), using the average of log10(TPM) across biological replicates for each type. Red dots show five biological replicates of APL; red line shows the mean APL expression level. Genes are grouped by type and sorted by fold difference in APL expression relative to non-APL MB neurons. Data from Aso et al., 2019. TPM, transcripts per million. (B) Heat map of TPM counts (log scale) for all genes shown in (A), for all 21 cell types.

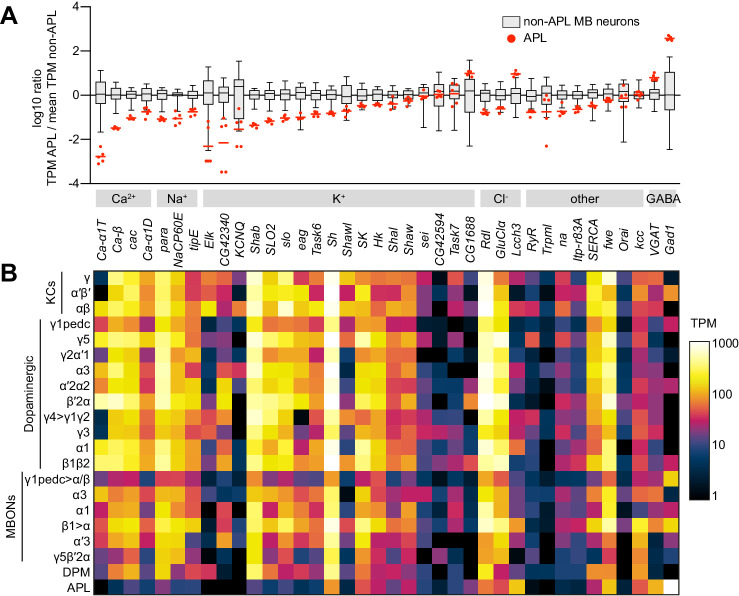
Figure 2—source data 1. Source data for Figure 2.

Figure 2.

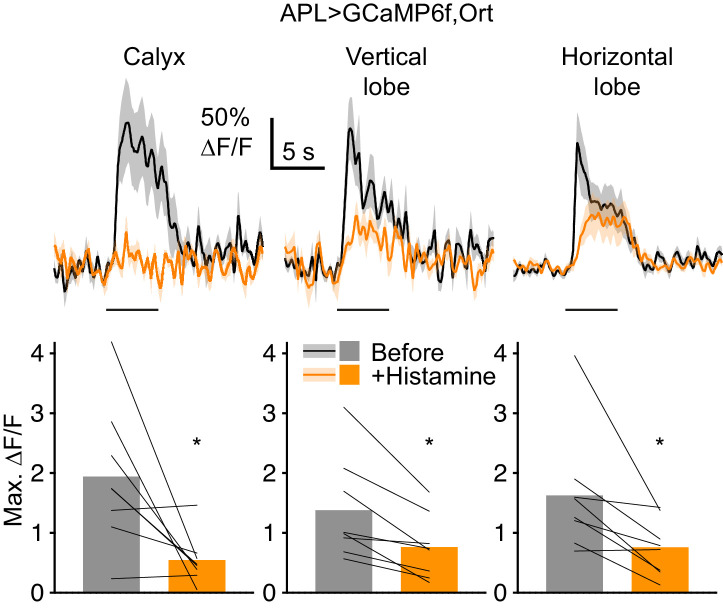
Figure 2—figure supplement 1. When APL expresses Ort, histamine reduces odor-evoked Ca2+ influx in APL.

Figure 2—figure supplement 1.

Traces (mean ± SEM shading) show APL responses to isoamyl acetate (horizontal bars) before (black) and after (orange) bath-applying 2 mM histamine, in flies expressing GCaMP6f and the histamine-gated Cl- channel Ort in APL, driven by NP2631-GAL4/GH146-FLP. Graphs show maximum ∆F/F (same colors as traces). Bars show mean, thin lines show paired data (same hemisphere before and after histamine). *p<0.05, paired t-test or Wilcoxon test. The residual GCaMP6f response most likely reflects calcium influx through nAChRs (cholinergic input to APL when APL is blocked by histamine would be much higher due to increased KC activity: Apostolopoulou and Lin, 2020). Apparent differences in effect size in different parts of APL might reflect differential localization of Ort or differential penetration of histamine into the brain. Note that when APL does not express Ort, histamine has no effect on Kenyon cell odor responses (Apostolopoulou and Lin, 2020) and thus is unlikely to non-specifically affect APL odor responses.
Figure 2—figure supplement 1—source data 1. Source data for Figure 2—figure supplement 1.