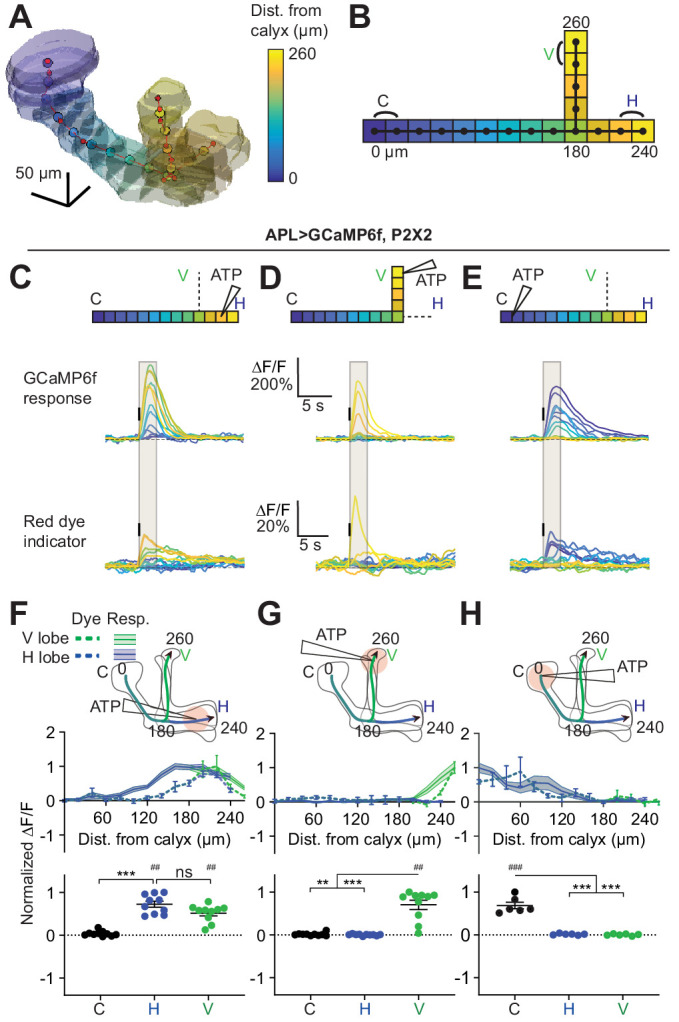
Figure 5. Quantification of activity spread in APL.
(A) 3D visualization of an example mushroom body manually outlined using mb247-dsRed as an anatomical landmark. The backbone skeleton is shown as a red line passing through the center of each branch of the mushroom body, manually defined by the red dots. Evenly spaced nodes every 20 µm on the backbone subdivide the mushroom body into segments, here color-coded according to distance from the dorsal calyx (scale on right). (B) Schematic of the ‘standard’ backbone with distances (µm) measured from the dorsal calyx. Color code as in panel A. In this and later figures, signals are quantified using the two outermost segments of the calyx (C, black), vertical lobe (V, green), and horizontal lobe (H, blue), as shown here. (C–E) Traces show the time course of the response in each segment of APL, averaged across flies, when stimulating APL with 0.75 mM ATP (10 ms puff at 12.5 psi) in the horizontal lobe (C), vertical lobe (D), or calyx (E), in VT43924-GAL4.2>GCaMP6f,P2X2 flies. Upper panels: GCaMP6f signal. Lower panels: Red dye signal. The baseline fluorescence for the red dye signal comes from mb247-dsRed. Color-coded backbone indicates which segments have traces shown (dotted lines mean the data is omitted for clarity; the omitted data appear in panels F–H). Gray shading shows the time period used to quantify ∆F/F in (F–H). Vertical black lines indicate the timing of ATP application. (F–H) Mean response in each segment (∆F/F averaged over time in the gray shaded period in C–E). The x-axis shows distance from the calyx (µm) along the backbone skeleton in the diagrams, and the color of the curves matches the vertical (green) and horizontal (blue) branches of the backbone. Solid lines with error shading show GCaMP responses; dotted lines with error bars show red dye. The responses in each panel were normalized to the highest responding segment (upper panels) or data point (lower panels). Error bars/shading show SEM. n, given as # neurons (# flies): (C, F, D, G) 10 (6), (E, H) 6 (4). ## p<0.01, ### p<0.001, one-sample Wilcoxon test or one-sample t-test, vs. null hypothesis (0) with Holm-Bonferroni correction for multiple comparisons. **p<0.01, ***p<0.001, Friedman test with Dunn’s multiple comparisons test or repeated measures one-way ANOVA with Holm-Sidak’s multiple comparisons test, comparing the stimulated vs the unstimulated sites. See Supplementary file 2 for detailed statistics.


