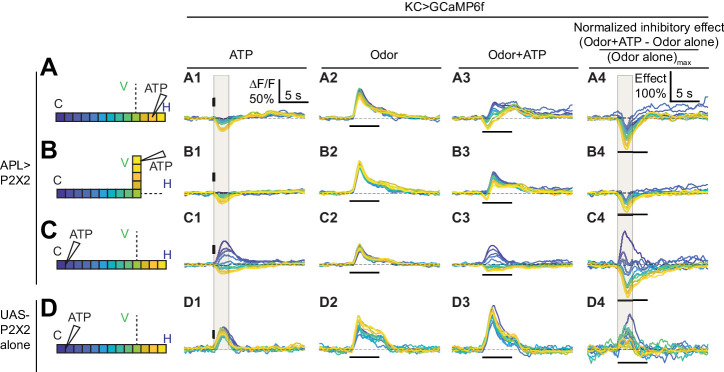
Figure 6. Time courses of APL’s inhibitory effect on KC activity.
Traces show the time course of the response in each segment of KCs, averaged across flies, when stimulating APL with 0.75 mM ATP (10 ms puff at 12.5 psi) in the horizontal lobe (A), vertical lobe (B), or calyx (C) in VT43924-GAL4.2>P2X2, mb247-LexA > GCaMP6f flies (no ATP stimulation in column 2). (D) shows responses in negative control flies (UAS-P2X2 alone). Columns 1–3 show responses of KCs to: (A1–D1) activation of the APL neuron by ATP, (A2–D2) the odor isoamyl acetate, (A3–D3) or both. (A4–D4) Normalized inhibitory effect of APL neuron activation on KC responses to isoamyl acetate (i.e. (column 3 - column 2)/(maximum of column 2)). The color-coded backbone indicates which segments have traces shown (dotted lines mean the data is omitted for clarity; the omitted data appear in Figure 7). Vertical and horizontal bars indicate the timing of ATP and odor stimulation, respectively. Gray shading in panels A1-D1 and A4-D4 indicate the intervals used for quantification in Figure 7 A2–C2 and A4–C4, respectively. The data in D1-D4 is quantified in Figure 7—figure supplement 2. n, given as # neurons (# flies): (A1–A4, B1–B4) 10 (9), (C1–C4) 9 (8), (D1–D4) 5 (3). Scale bar in A1 applies to columns 1–3; scale bar in A4 applies to column 4.

