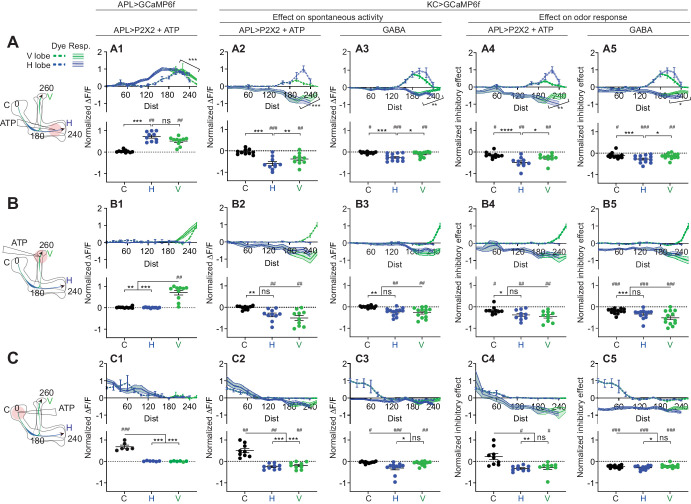
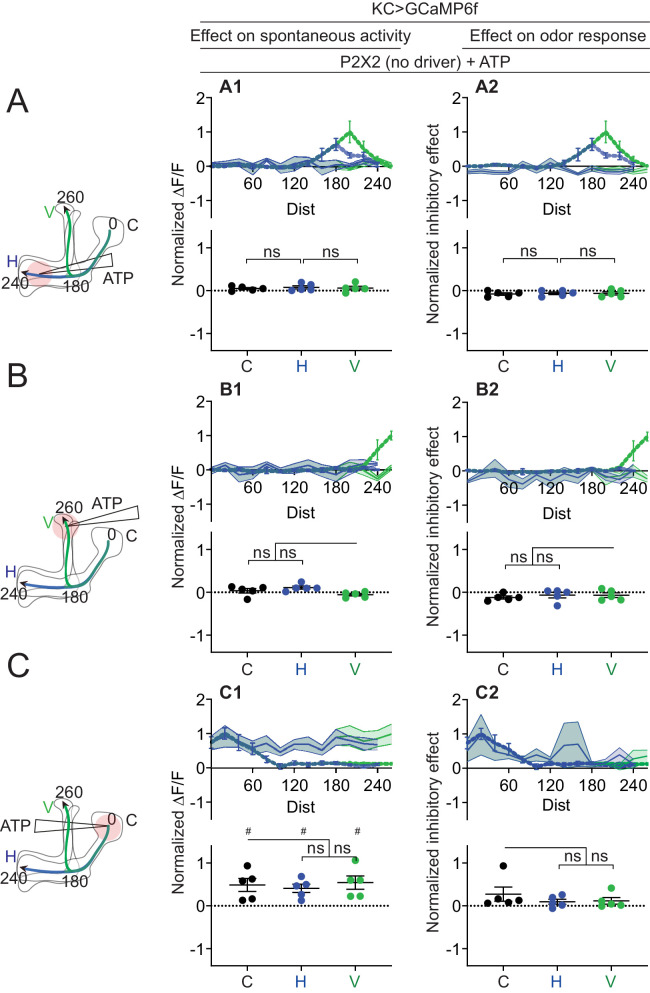
Figure 7. Quantification of the inhibitory effect of GABA or the APL neuron on KC activity.
Rows: Local application of ATP (0.75 mM) or GABA (7.5 mM) in the horizontal lobe (A1–A5), vertical lobe (B1–B5) or calyx (C1–C5). Columns: Column 1: APL’s response to ATP stimulation (A1–C1) in VT43924-GAL4.2>GCaMP6f,P2X2 flies, repeated from Figure 5 for comparison. Columns 2–3: KC responses to local activation of APL by ATP (A2–C2) or to GABA application (A3–C3). Columns 4–5: Normalized inhibitory effect of APL activation (A4–C4) or GABA application (A5–C5) on KC responses to isoamyl acetate. Genotypes: for ATP (columns 2,4): VT43924-GAL4.2>P2X2, mb247-LexA > GCaMP6f; for GABA (columns 3,5): OK107-GAL4 > GCaMP6f. Data shown are mean responses in each segment (averaged over time in the gray shaded periods in Figure 6). The x-axis (‘Dist’) shows distance from the calyx (µm) along the backbone skeleton in the diagrams (left), and the color of the curves matches the vertical (green) and horizontal (blue) branches of the backbone. Solid lines with error shading show GCaMP responses; dotted lines with error bars show red dye. The responses were normalized to the segment (upper panels) or data point (lower panels) with the largest absolute value across matching conditions (columns 2+3, or columns 4+5). The baseline fluorescence for the red dye comes from bleedthrough from the green channel; only trials without odour were used for red dye quantification, in these trials, the change in green bleedthrough (~10–40%) is negligible compared to the increase in red signal (150–300%). Error bars/shading show SEM. n, given as # neurons (# flies): (A1, B1) 10 (6), (C1) 6 (4), (A2, A4, B2, B4) 10 (9), (C2, C4) 9 (8) (A3, A5, B3, B5) 13 (8), (C3, C5) 11 (6). # p<0.05 ### p<0.001, one-sample Wilcoxon test, or one-sample t-test, vs. null hypothesis (0) with Holm-Bonferroni correction for multiple comparisons. *p<0.05, ***p<0.001, Friedman test with Dunn’s multiple comparisons test, or repeated-measures one-way ANOVA with Holm-Sidak multiple comparisons test, comparing the stimulated site vs. the unstimulated sites. Diagonal brackets in (A1–A5), paired t-test or Wilcoxon test comparing the response at segment 200 vs. 260 on the vertical branch. See Supplementary file 2 for detailed statistics.


