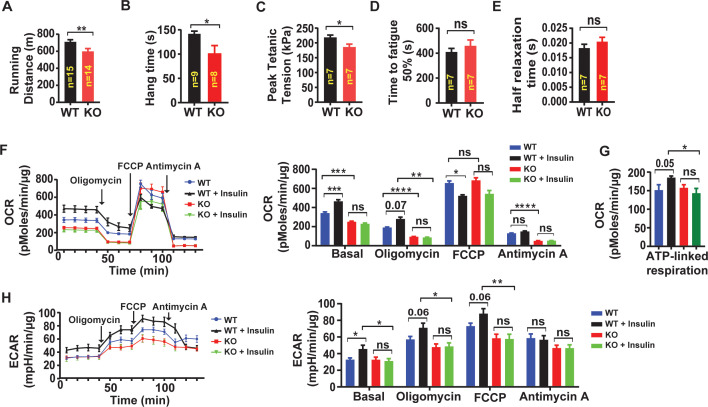
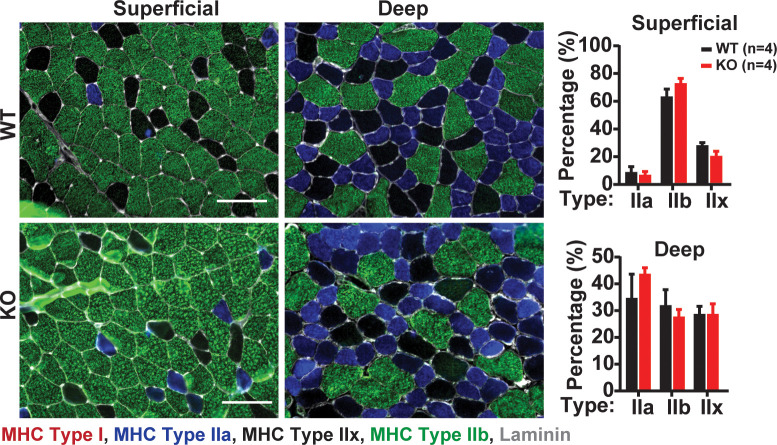
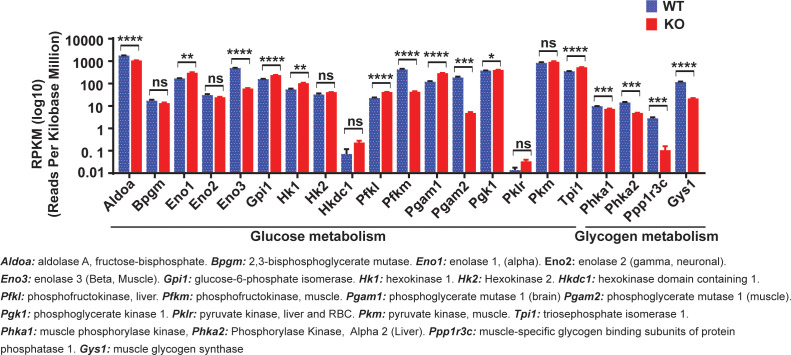
Figure 7. Skeletal muscle-targeted LRRC8A deletion impairs muscle endurance, force generation and insulin-stimulated oxygen consumption.
(A) Exercise treadmill tolerance test for KO mice (n = 14) compared to WT littermates (n = 15). (B) Hang times on inversion testing of KO (n = 8) and WT (n = 9) mice. (C–E) Ex vivo isometric peak tetanic tension (C), time to fatigue (D) and half relaxation time (E) of isolated soleus muscle from KO (n = 7) compared to WT (n = 7) mice. (F) Oxygen consumption rate (OCR) in WT and Lrrc8a KO primary myotubes +/- insulin stimulation (10 nM) (n = 6 independent experiments) and quantification of basal OCR, OCR post-Oligomycin, OCR post-FCCP and OCR post-Antimycin A. (G) ATP‐linked respiration obtained by subtracting the OCR after oligomycin from baseline cellular OCR. (H) Extracellular acidification rate (ECAR) in WT and Lrrc8a KO primary myotubes +/- insulin stimulation (10 nM) (n = 6 independent experiments) and quantification of basal OCR, OCR-post Oligomycin, OCR-post FCCP and OCR post-Antimycin A. Statistical significance between the indicated values were calculated using a two-tailed Student’s t-test. Error bars represent mean ± s.e.m. *, p<0.05, **, p<0.01, ***, p<0.001, ****, p<0.0001.


