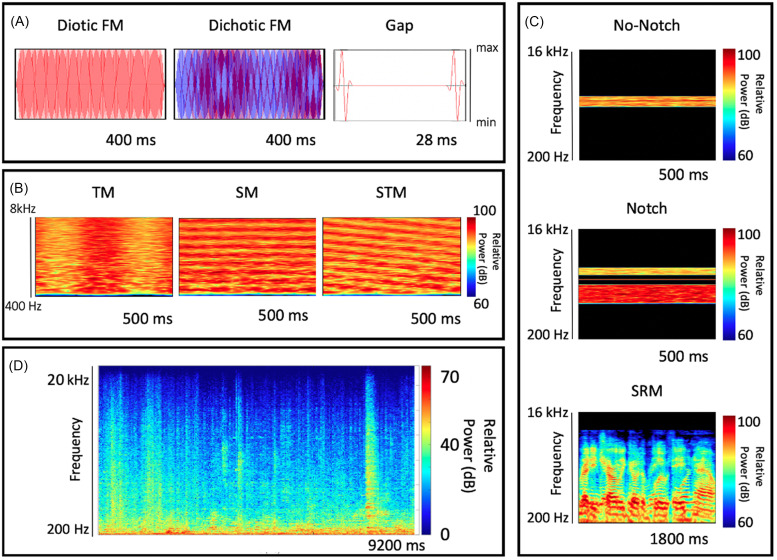
FIG. 2.
(Color online) Visual representations of the stimuli employed for each assessment grouped by sub-battery are shown in (A)–(C). Amplitude envelopes for the TFS sub-battery are shown in (A) and spectrograms for the rest of the assessments are shown in (B) and (C). A representative nine-second segment of the cafeteria noise utilized for the noise condition is shown in (D). The total recording had a duration of 11 min and was played in a continuous loop during testing.

