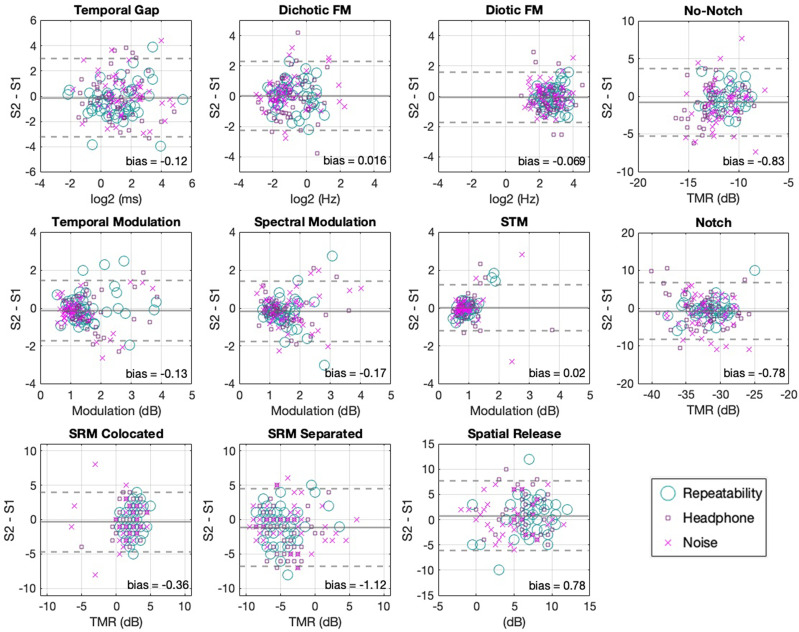
FIG. 4.
(Color online) The mean threshold of both sessions is plotted against their difference, showing the LoA between sessions for all tests. The solid lines indicate the mean difference between sessions. Dotted lines indicate the 95% LoA. Solid lines that fall below zero indicate better performance on session 2 (except the spatial release metric). Different markers illustrate the different conditions.

