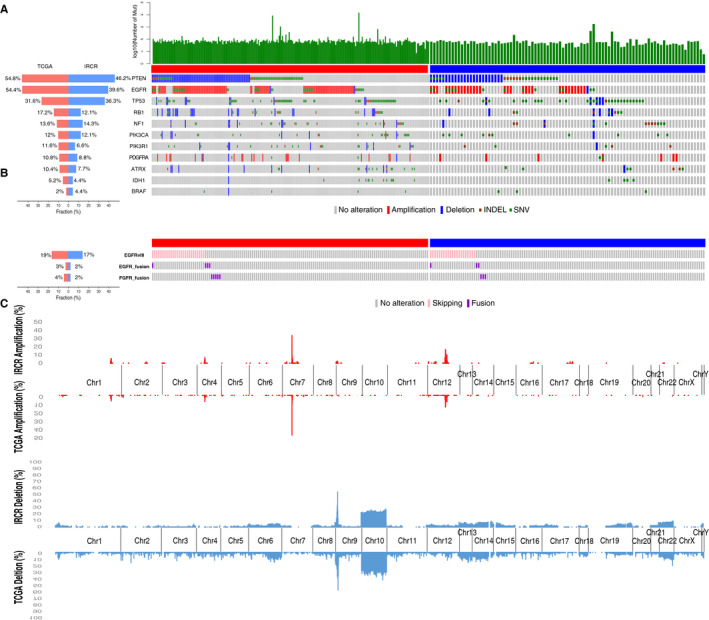
FIGURE 2.

Genomic landscape of primary glioblastoma in TCGA and IRCR cohorts. (A) Each samples in TCGA and IRCR cohorts are annotated for their mutation, copy number alteration, exon skip and fusion. (B) EGFRvIII, EGFR,and FGFR fusions that were detected from two cohorts (136/126 in TCGA/IRCR) with RNA sequencing data are shown. (C) Focally amplification (log2(CN/2) > 1.58, red) and deletion (log2(CN/2) < −0.75, blue) are plotted on each chromosome. Bottom side: TCGA, Top side: IRCR
