FIGURE 4.

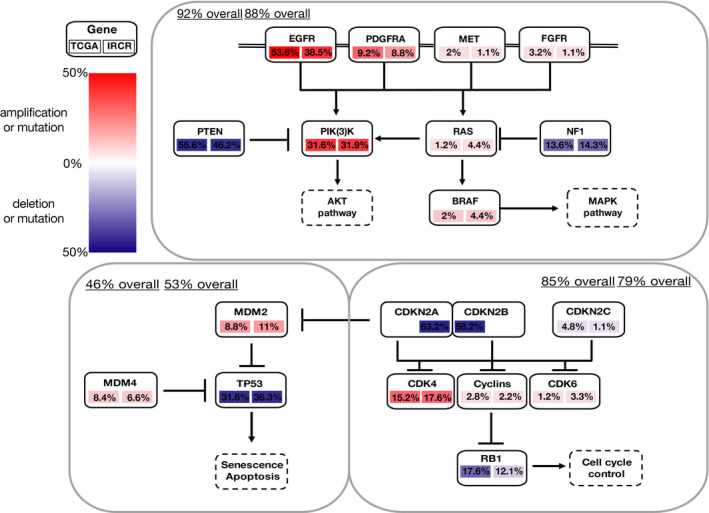
Landscape of major pathway alterations in primary GBM. Overall analysis proportion is summarized for PI3K/MAPK, p53 and Rb regulatory pathway. Amplification (log2(CN/2) > 1.58) and deletion (log2(CN/2) < −0.75, blue)

Landscape of major pathway alterations in primary GBM. Overall analysis proportion is summarized for PI3K/MAPK, p53 and Rb regulatory pathway. Amplification (log2(CN/2) > 1.58) and deletion (log2(CN/2) < −0.75, blue)