
Figure 4.
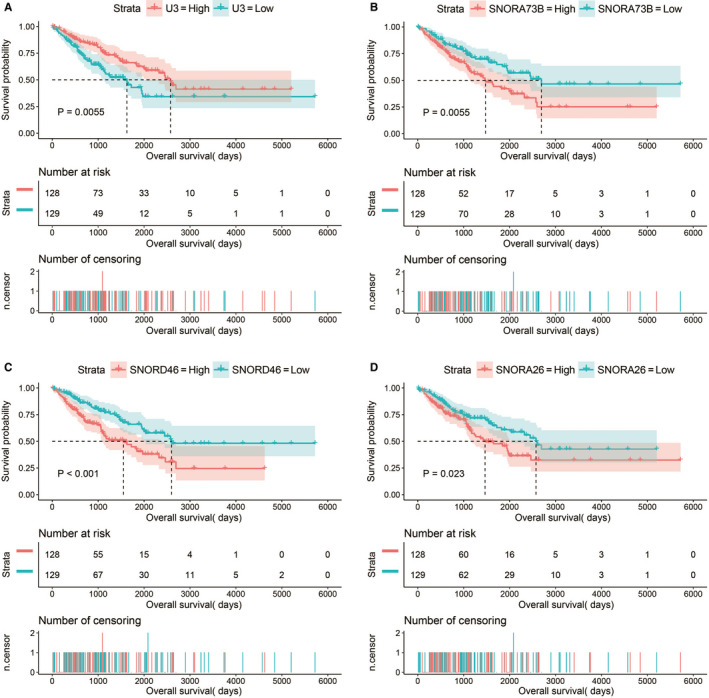
Kaplan‐Meier curves of four prognostic snoRNAs. A, Kaplan‐Meier curves of U3; B, Kaplan‐Meier curves of SNORA73B; C, Kaplan‐Meier curves of SNORD46; D, Kaplan‐Meier curves of SNORA26
Official websites use .gov
A
.gov website belongs to an official
government organization in the United States.
Secure .gov websites use HTTPS
A lock (
) or https:// means you've safely
connected to the .gov website. Share sensitive
information only on official, secure websites.
Kaplan‐Meier curves of four prognostic snoRNAs. A, Kaplan‐Meier curves of U3; B, Kaplan‐Meier curves of SNORA73B; C, Kaplan‐Meier curves of SNORD46; D, Kaplan‐Meier curves of SNORA26