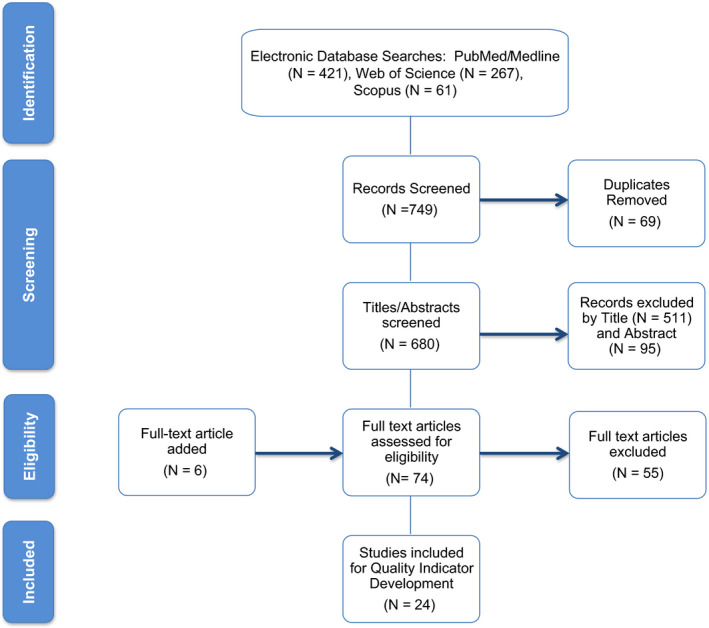
FIGURE 1.

Flow diagram of studies selection. The PRISMA flow diagram details the process of article identification and selection for inclusion. The initial database search resulted in 749 records; after duplicates removed, 680 abstracts were screened. This process left 74 records to assess for eligibility by screening the full‐text articles. An additional six records were identified from other sources. Twenty‐four articles were finally included for the development of quality indicators. PRISMA = preferred reporting items for systematic reviews and meta‐analyses
