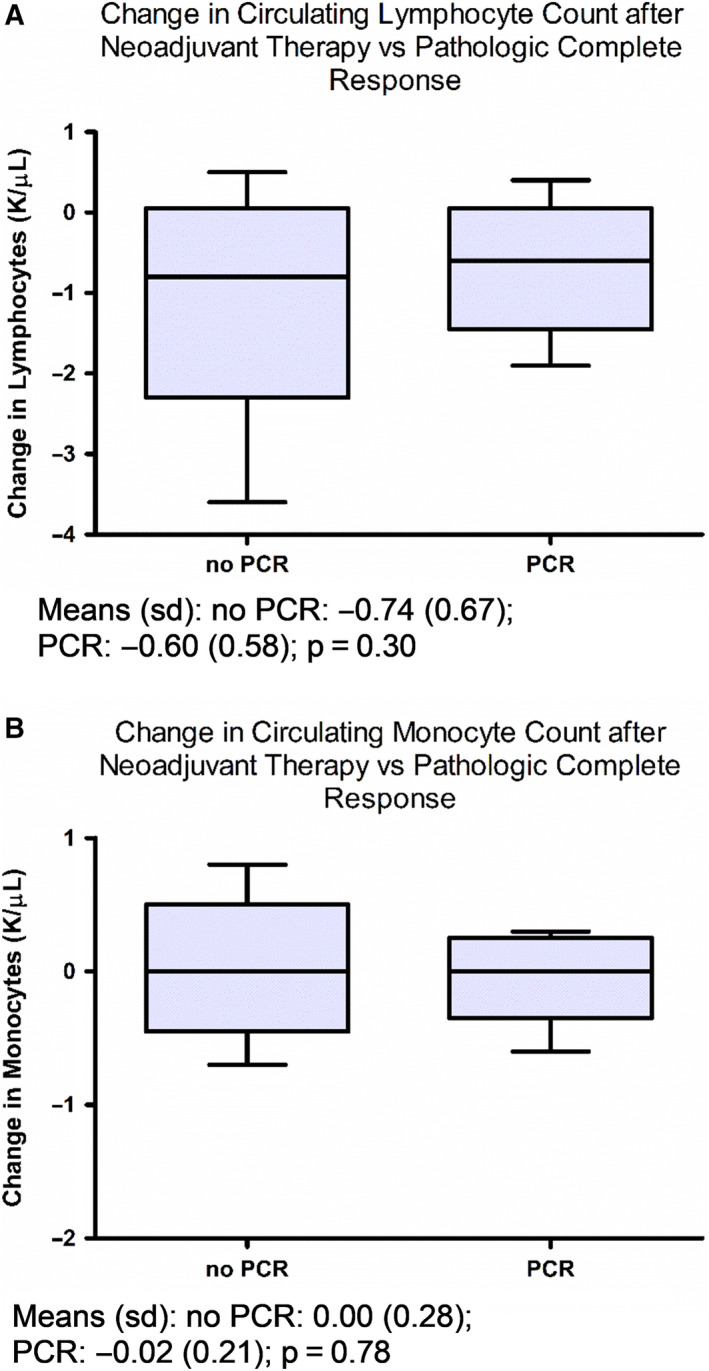
Figure 2.

Relationship of changes in circulating lymphocytes or monocytes with pCR. Box plots indicate median, interquartile range, and minimum/maximum. Association of circulating (A) lymphocyte and (B) monocyte count changes before and after neoadjuvant chemotherapy with pCR. Means (SD) and P‐values by t test are reported
