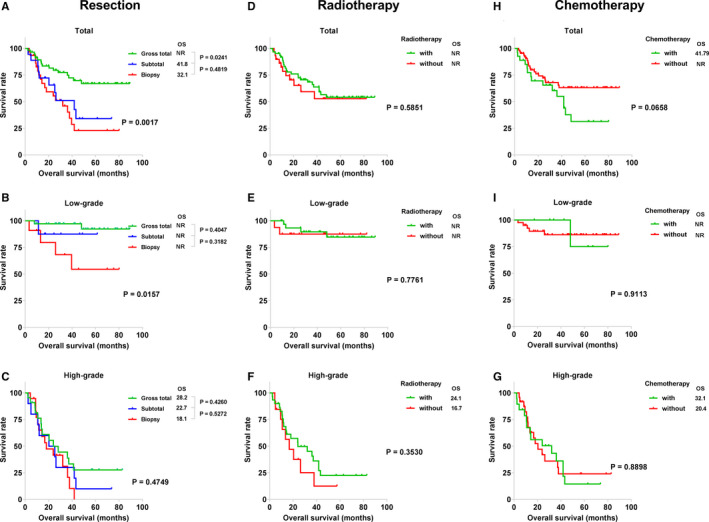
FIGURE 3.

Kaplan‐Meier survival analysis of present treatment, showing the effects of the extent of resection (A, total; B, low‐grade; C, high‐grade), radiotherapy (D, total; E, low‐grade; F, high‐grade), and chemotherapy (H, total; I, low‐grade; G, high‐grade) on patient survival. NR, not reached; OS, overall median survival
