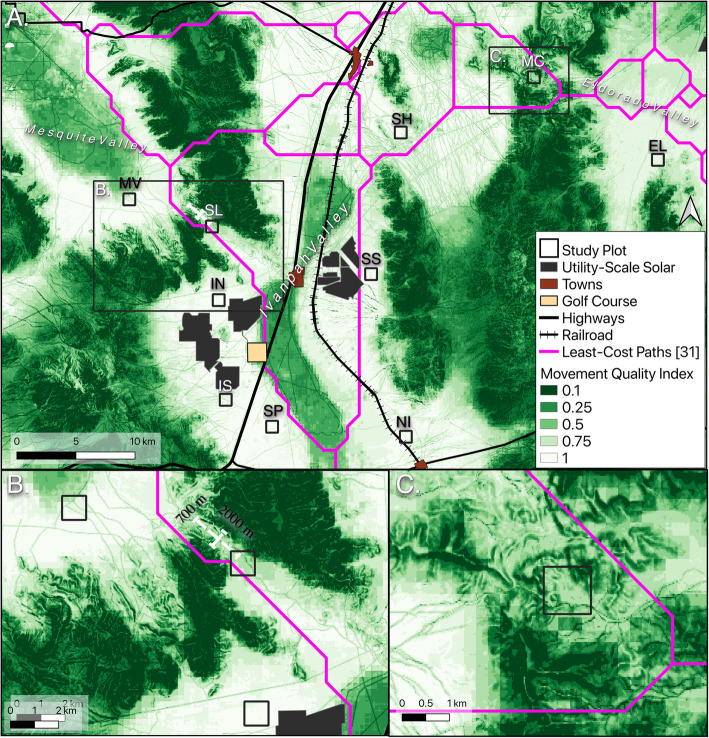
Fig. 6.
Tortoise movement quality map for entire study region (a), Stateline Pass area (b) and McCullough Pass area (c). Displayed values are quantiles of the movement prediction; higher values indicate areas that tortoises are predicted to move through with little resistance. Tortoises are less likely to move through rugged terrain and areas of low habitat suitability (dry lakes). The area to the northwest of the Stateline Pass study plot contains a strip of suitable movement habitat (represented by the white crosshairs) that functions as a corridor to connect the two valleys. In contrast, the area around the McCullough Pass plot contains terrain that is much more difficult for tortoises to traverse. Pink line overlays represent Least-Cost-Paths from [31]

