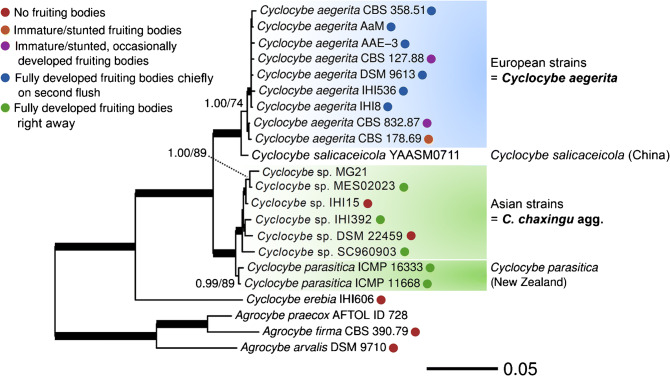
Fig. 2.
Maximum likelihood (ML) tree of Cyclocybe aegerita and adjacent species, based on a concatenated multigene alignment of ribosomal (ITS, LSU) and proteinogenic (TEF1α, RPB2) DNA sequences. Support values above the branches: left side = % Bayesian inference posterior probability (PP); right side = % ML bootstrap value (BT) in absolute numbers. Branches of significant support (PP ≥ 0.99 and BT ≥ 95%) are thickened. Only support values of PP ≥ 0.90 and BT ≥ 70 are displayed for each node. Coloured circles encode the fruiting performance of each tested strain in the fruiting setup of Herzog et al. (2016); the term 'stunted' means that either aborted immature basidiomes and/or aborted primordia were seen with a certain strain

