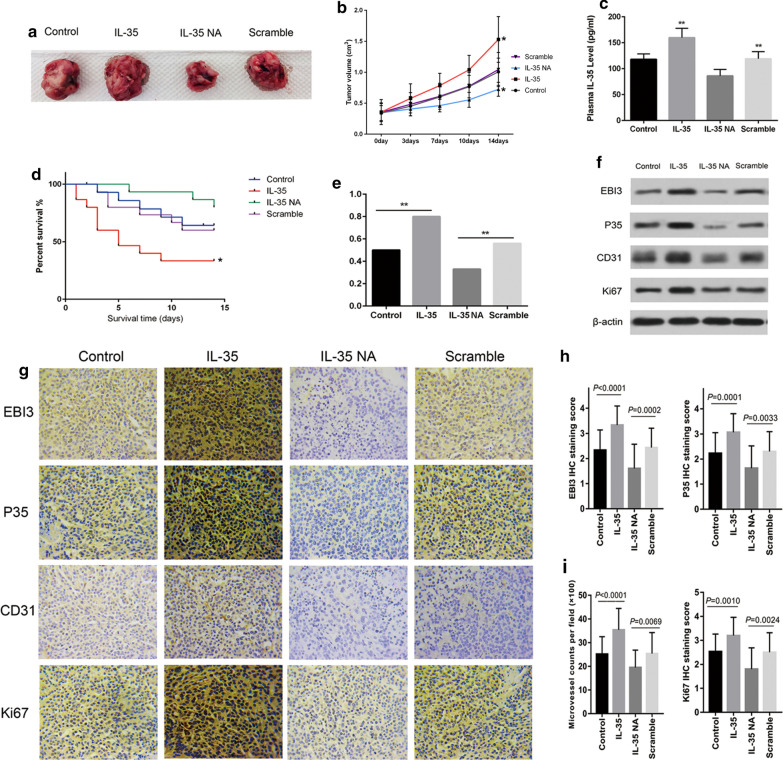
Fig. 3.
Experimental results in mice. a Tumors image in four groups. b Growth curves of tumors of indicated groups. *p < 0.05. c Concentration of IL-35 in mice plasma of indicated groups. **p < 0.01. d Survival curves of mice in four groups. *p < 0.05. e Detection of metastatic PCA in the excised lung tissue by HE staining. Incidence of lung tumor metastasis was examined at day 15. p value was determined using Fisher’s exact test. **p < 0.01. f EBI3, p35, CD31 and Ki67 expressions in tumor tissues. g IHC staining for CD31 was performed to determine the MVD in tumor tissues. Ki67 represents the ability of cell proliferation. Representative images of IHC staining for EBI3, IL12A, CD31 and Ki67. (×200). h EBI3 and p35 staining scores in each group. i Left, the microvessel counts per field in each group (×100). Right, Ki67 staining scores in each group. Data are presented as mean ± SD

