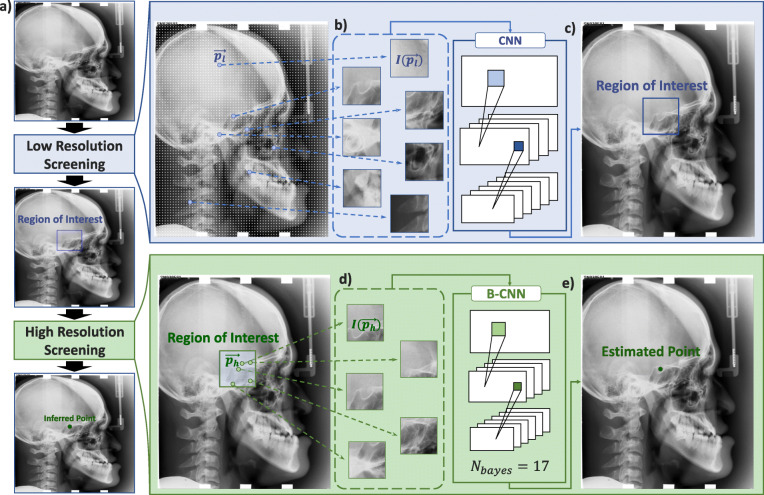
Fig. 1.
Schematic of the overall detection framework. a Original lateral cephalogram (lat ceph) gets downsampled by a factor of 3. b From the downsampled lat ceph, image batches () are sampled with a stride of 3 mm along the width and the height direction from all over the lat ceph. c From the LRS calculation, CNN model provides a region of interest for the target landmark to be located in. d Every single pixel from the ROI is, again, sampled as an image batch () to be put into Bayesian CNN(B-CNN) model for iterative calculations. e HRS provides the final predicted target position for the target landmark

