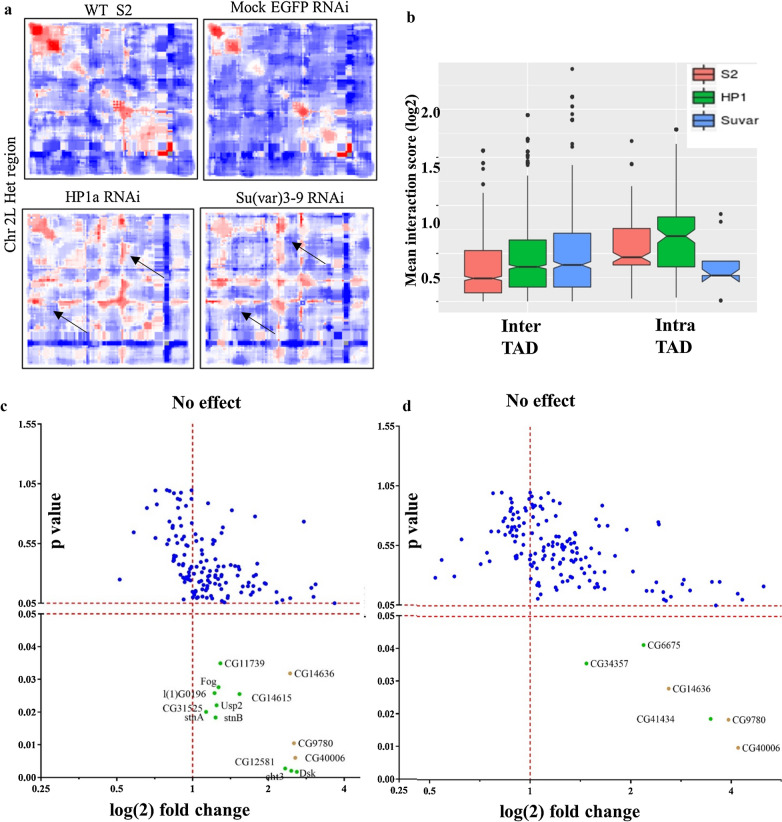
Fig. 4.
HP1a and Su(var)3-9 RNAi results in loss of TAD insulation with minimal effect on heterochromatic gene expression a) comparison of the heatmaps across the heterochromatic regions of chr 2L included in the 5C seq in WT, mock RNAi, HP1a RNAi and Su(var)3-9 RNAi-treated cells. a The increase in inter-TAD interactions is evident from the increase in longer range interactions (black arrows) with high interaction frequency on either side of the diagonal of the heatmap. b Quantification of the effect of knockdown of HP1a and Su(var)3-9 on the inter and intra-TAD interaction frequencies using notched box plot where the notch indicates the median value at 95% confidence interval. The median notch of the WT and HP1a RNAi or Su(var)3-9 RNAi conditions do not coincide indicating the gain of new interactions, with high interaction scores (including the outliers). c Scatter plot showing the effect of HP1a and d) Su(var)3-9 knockdown on the expression levels of heterochromatic genes (n = 3). Differentially expressed (Student’s T test; p value < 0.05) genes are labeled in green. DEGs common between HP1a and Su(var)3-9 RNAi are marked in yellow

