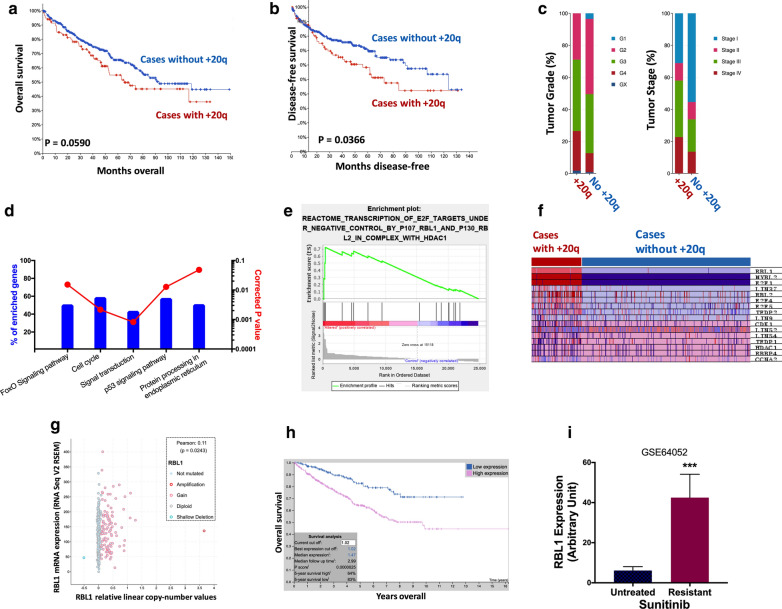
Fig. 2.
+20q and resistance to Sunitinib and Cabozantinib. Reproduced from TCGA, shown were a overall survival, b progression-free survival and c clinicopathological parameters of patient with and without +20q; Gene enrichment and functional annotation analysis in TCGA cases with or without +20q using the d NET-GE and e GSEA platforms with f genes of interest shown in heatmap; g Reproduced from TCGA dataset, shown was correlation between copy number against corresponding mRNA expression of the gene of interest; h Reproduced from TCGA and Human Protein Atlas dataset, shown was overall survival of patients with higher and lower RBL1 expression with automatically designated cutoff value; i Reproduced from GEO dataset, shown was RBL1 expression in Sunitinib –untreated and –resistant RCC cells (Data were presented as mean ± standard deviation; *P < 0.05; **P < 0.01; ***P < 0.001)

