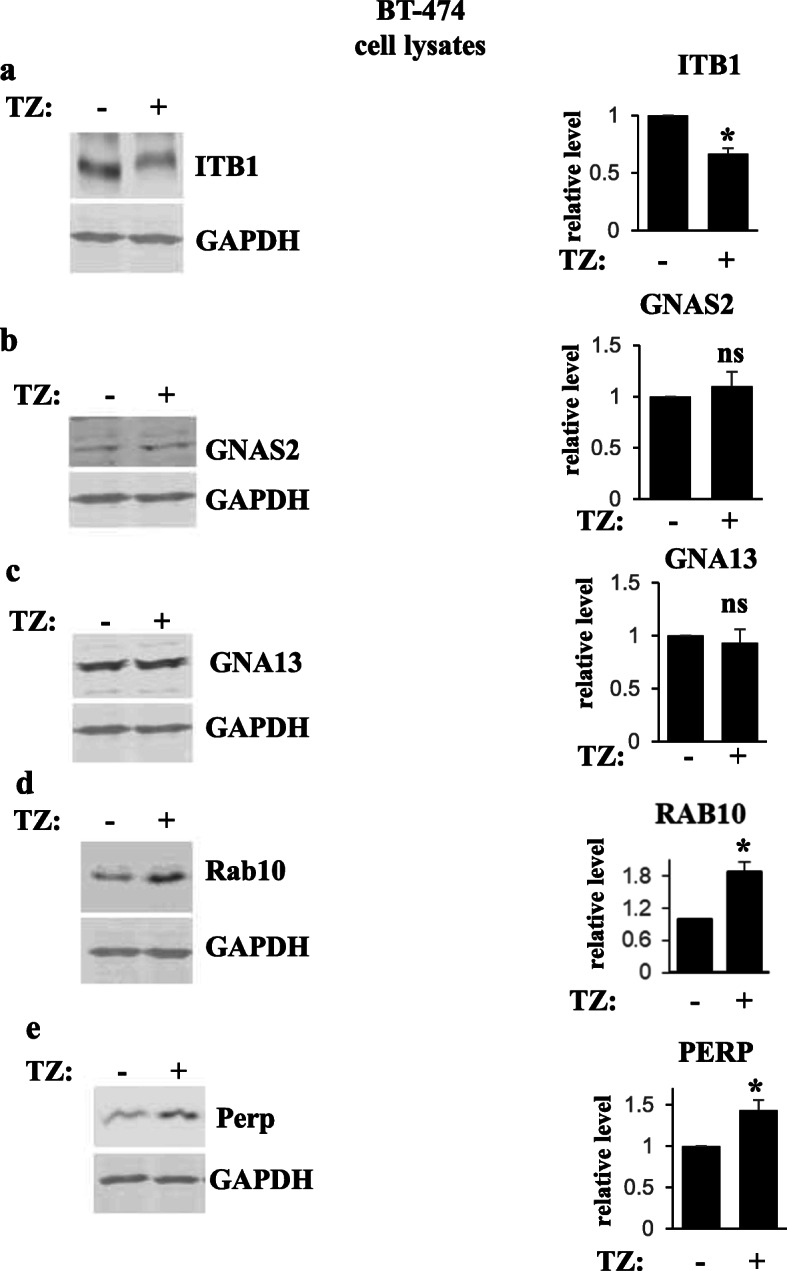
Fig. 6.

Western blot analysis of protein levels in human ErbB2-positive breast tumor cells. BT-474 were treated (+) or not (−) with trastuzumab (TZ) for 48 h, and cell lysates were assayed for ITB1 (a), GNAS2 (b), GNA13 (c), Rab 10 (d), and Perp (e) levels by western blotting. GAPDH served as a loading control. Bar graphs to the right of the western blot images represent quantification of respective bands. Protein levels were normalized by the levels of the loading control. Protein levels (relative level) in the control cells were designated as 1.0. The data represent the average of three independent experiments, plus SD. *p value was < 0.05, ns not significant
