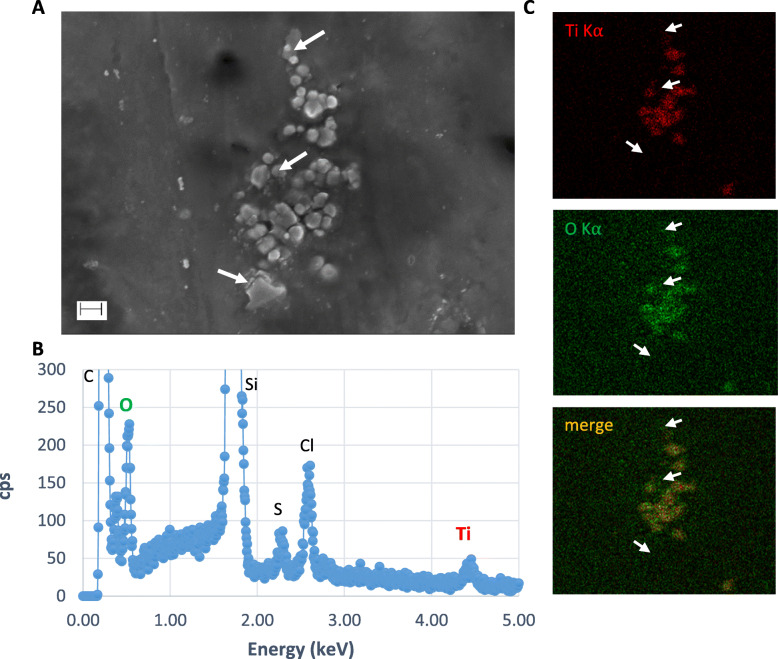
Fig. 4.
Analysis of TiO2 particles by SEM-EDX in foetal exudate. a SEM images of particles agglomerated in the dried PM after sample preparation of foetal exudate taken up from the 20–30 min period of perfusion. b Corresponding EDX analyses of particles into agglomerates showing the presence of C, Cl, S, Ti and O (Si signal from SEM wafer). c SEM-EDX cartography of particles showing Ti (red) and O (green) elements, and corresponding merge image. White arrows indicate examples of particles negative for Ti and O in this preparation. Scale bar = 200 nm

