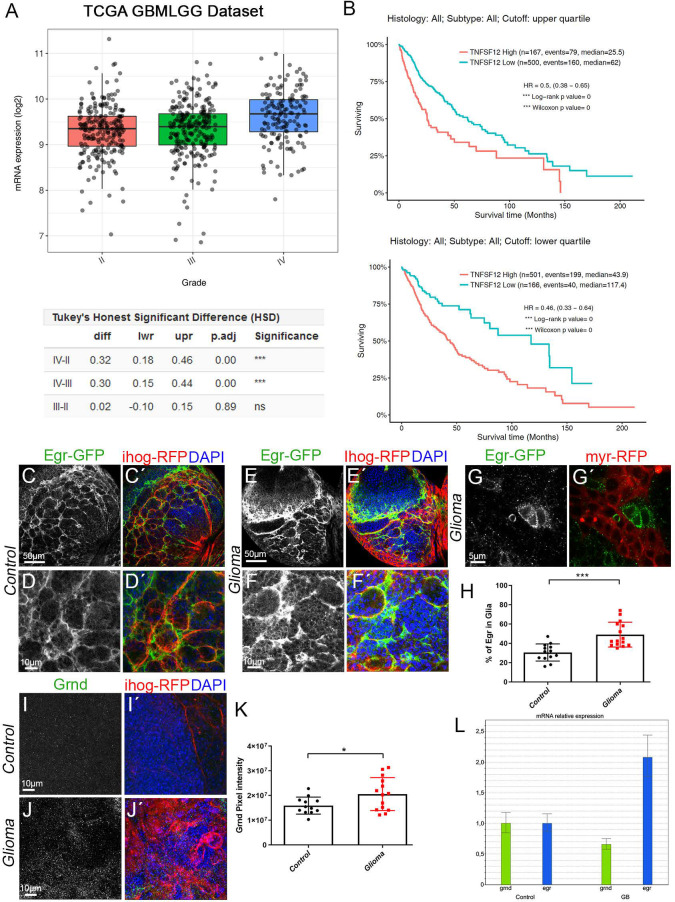
Fig. 2.
Egr re-localises from neuron to glia and its receptor Grindelwald is accumulated in GB. (A,B) In silico analysis of the data from the TCGA dataset from GlioVis (http://gliovis.bioinfo.cnio.es/) showing that TNFSF12 is highly upregulated in several tumours of the CNS of glial origin, including GB (grade IV), the statistical analysis extracted from the database is shown in the table below the graph (A). In silico analysis of TCGA data indicating the survival of patients with high or low TNFSF12 expression. Upper graph shows the upper quartile and the graph below shows the lower quartile (B). (C-J′) Brains from third-instar larvae. Glia are labelled with UAS-Ihog-RFP (gray or red in the merge) driven by repo-Gal4 to visualise active cytonemes/TM structures in glial cells. Egr protein is visualised by GFP staining (green) of a transgenic Drosophila line in which the endogenous egr gene is GFP tagged (Egr-GFP protein fusion reporter). (C,D) In control brain sections, 30% of Egr-GFP (gray or green in the merge) signal localised in glial cells while most Egr-GFP signal (70%) localised in the surrounding cells that are in close contact with glial cells. (E–G) In glioma brain sections, Egr-GFP (green) signal shifts and 50% of the GFP signal localised in glioma cells and the remaining 50% localised in the healthy surrounding cells. Higher magnification image of a glioma brain section is shown in (G). (H) Quantification of the percentage of Egr-GFP localised in glial cells in control and glioma samples. (I,J) Grnd staining (gray or green in the merge) in control and glioma samples. (K) Quantification of the Grnd pixel intensity in control and glioma samples. Nuclei are marked with DAPI (blue). (L) qPCRs with RNA extracted from control and glioma larval brains showing a twofold increase of the transcription (mRNA levels) of egr. Data from two independent experiments, n>10 samples analysed for each genotype per experiment. Two-tailed t-test with Welch’s correction. Error bars show mean±s.d.; * P<0.05, ***P≤0.0001. Scale bar size is indicated in all figures. The expression system was active, and the GB induced, during the whole development including both embryonic and larval stages in all experiments in this figure. Genotypes: (C,D) Egr-GFP; repo-Gal4, ihog-RFP/UAS-lacZ; (E,F) UAS-dEGFRλ, UAS-dp110CAAX;Egr-GFP; repo-Gal4, UAS-ihog-RFP; (G) UAS-dEGFRλ, UAS-dp110CAAX; Gal80ts; Egr-GFP; repo-Gal4, myr-RFP; (I) repo-Gal4, ihog-RFP/UAS-lacZ; (J) UAS-dEGFRλ, UAS-dp110CAAX;; repo-Gal4, UAS-ihog-RFP.

