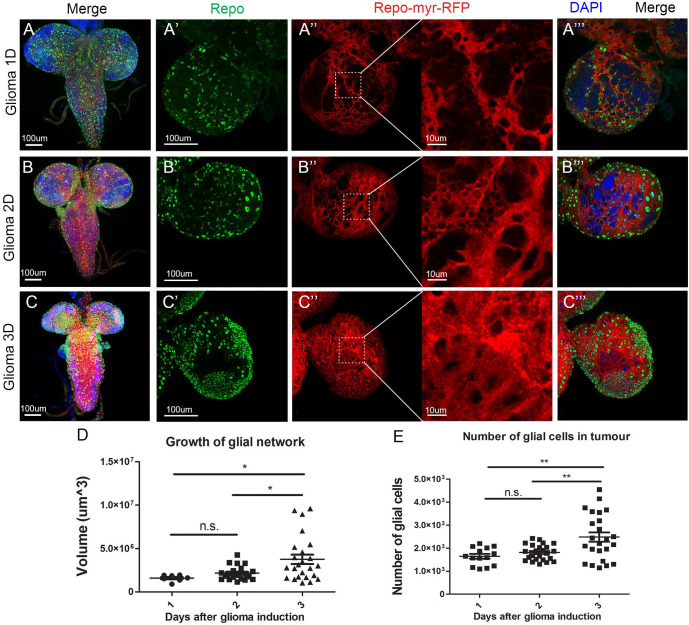
Fig. 5.
GB TM network volume and number of glial cells after 1, 2 and 3 days of tumour induction. Larval brain sections from third-instar larvae at several magnifications (A–C) show whole brains, (A′–C‴) show single brain hemispheres. Glial cell bodies and membranes are labelled with UAS-myr-RFP (red) driven by repo-Gal4 and glial cell nuclei are stained with Repo (green) and visualised as green spots. The insets of the red channel in (A″–C″) show higher magnifications for a detailed visualisation of the glioma network of TMs. (A) Third-instar larval brain after 1 day of tumour induction. (B) Third-instar larval brain after 2 days of tumour induction. (C) Third-instar larval brain after 3 days of tumour induction. (D) Quantification of the/glioma network volumes after induction of the glioma for 1, 2 or 3 days. (E) Quantification of the number of Repo+ cells after induction of the glioma for 1, 2 or 3 days. Nuclei are marked with DAPI (blue). Scale bar size is indicated in all figures. n=3 independent experiments, n>10 samples analysed for each timepoint per experiment. One-way ANOVA with Bonferroni post-hoc test. Error bars show mean±s.d.; *P≤0.05; **P≤0.01; n.s., not significant. Animals were raised at 17° C, shifted to 29°C for 1, 2 or 3 days at ∼8, 6 or 4 days AEL, respectively. Genotypes: (A-C) UAS-dEGFRλ, UAS-dp110CAAX; Gal80ts; repo-Gal4, myr-RFP.

