Fig. 2.
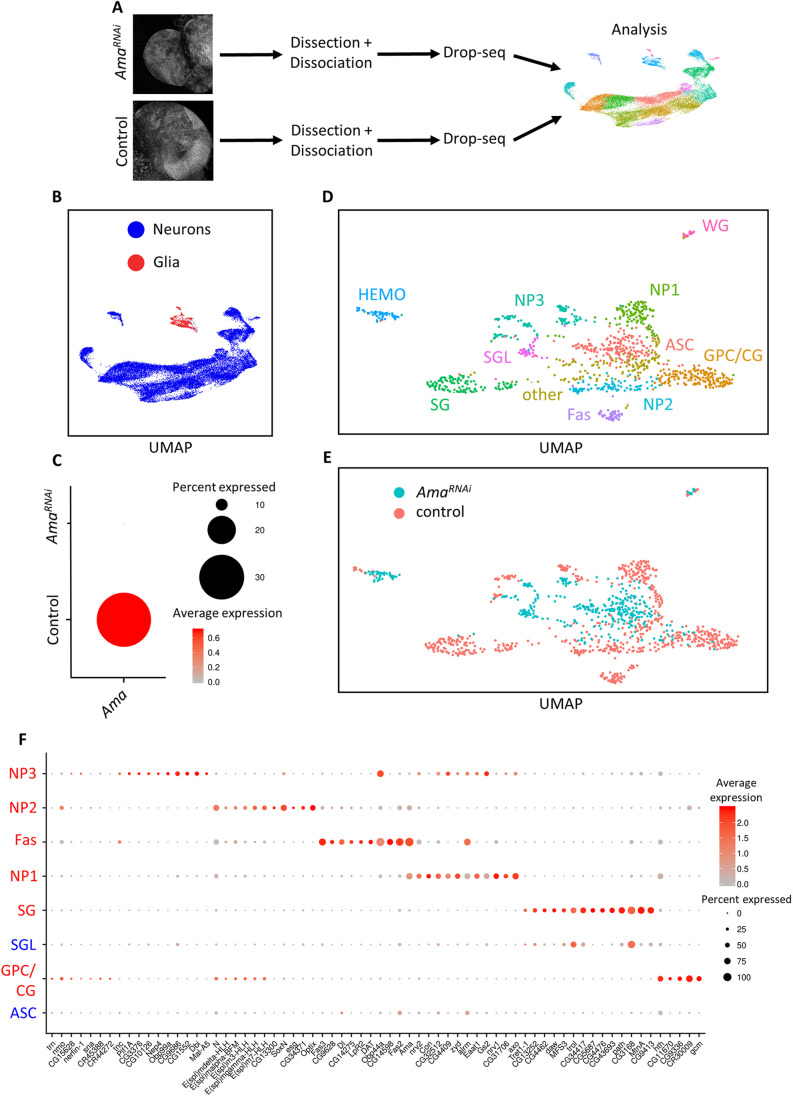
scRNA-seq identifies cellular perturbations following Ama knockdown. (A) Illustration of scRNA-seq pipeline. Third-instar larval brains from Control (repo>+) and AmaRNAi (repo>AmaRNAi) were dissected then dissociated into a single-cell suspension. Drop-seq was performed to capture single cells and generate cDNA libraries. Following alignment and generating a single-cell gene expression matrix, the samples were analyzed using Seurat to unbiasedly find cell clusters having distinct gene expression profiles. (B) UMAP of 25,700 cells outlying the neuronal and glial cells from the combined repo>+ (16,553 cells) and repo>AmaRNAi (9147 cells) scRNA-seq brains. (C) Dot plot in repo>+ and repo>AmaRNAi brains displaying the depletion of Ama expression using scRNA-seq. The red color represents the average expression of Ama (average log fold change), whereas the size of the dot represents the percentage of cells expressing Ama. (D) UMAP from the supervised analysis on glial cells from repo>+ and repo>AmaRNAi brains displaying ten distinct clusters. GPC/CG, glia precursor cells/cortex glia; ASC, AmaRNAi specific cluster; SG, surface glia; SGL, surface glia-like; NP1, neuropil glia 1; NP2, neuropil glia 2; NP3=neuropil glia 3; Fas, fasciclin cluster. (E) UMAP from D showing the genotype of each cell. (F) Dot plot displaying the top markers in different clusters from the analysis in D. The red color gradient shows the average expression of the genes (average log fold change), whereas the dot size shows the percentage of cells in the cluster expressing the gene. ASC glia do not share markers of other control glial cluster. SGL share markers with SG cells. Clusters labeled in red are observed in the repo>+ supervised glial analysis. Clusters labeled in blue are additional clusters that appeared after pooling repo>+ cells with repo>AmaRNAi brains. HEMO and WG are excluded as they originate from the hemolymph and the peripheral nervous system, respectively, and not the brain. In this analysis, GPC and CG results were pooled.

