Fig. 3.
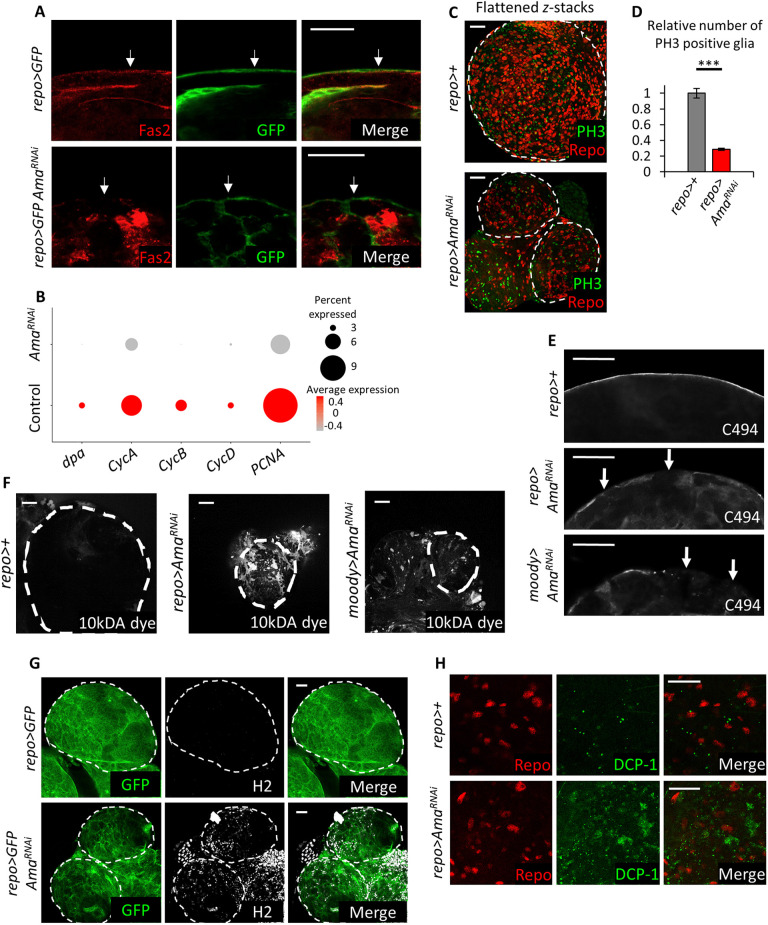
Ama depletion decreases glial cell proliferation and disrupts the BBB. (A) Immunofluorescence images showing that there is a decrease in Fas2 in surface glia following Ama knockdown. Final genotype: repo>mCD8GFP (top panel) repo>mCD8GFP AmaRNAi (bottom panel). White arrow points at surface glia. (B) Dot plot indicating a decrease in expression level of cell cycle genes dpa, CycA, CycB, CycD, and PCNA using scRNA-seq in repo>+ and repo>AmaRNAi glia. The red color gradient represents the average expression of the genes (average log fold change), whereas the size of the dot represents the percentage of cells expressing the genes. (C) Flattened z-stacks of repo>+ and repo>AmaRNAi brain immunofluorescence with REPO and PH3 showing that Ama knockdown decreases overall Repo and PH3 colocalization. (D) Quantification of Repo and PH3 colocalization in C reveals a significant reduction in mitotically active glia following Ama depletion. Z-stacks from repo>+ (n=5) and repo>AmaRNAi (n=6) brains were counted and normalized to the average count in repo>+ (set at 1). Data represents the mean±s.e.m. after normalization. ***P<0.001 (Student's t-test; Table S9). (E) C494 immunofluorescence labeling SPG of third-instar larval brains showing discontinuous surface glia membranes following Ama knockdown. White arrows point to discontinuous membranes. (F) Brains labeled with 10 kDa dextran dye indicates that Ama knockdown increases dye penetration in the tissue, implying a damaged BBB. (G) Immunofluorescence using pan hemocyte H2 antibody shows a strong signal in the brain in repo>AmaRNAi. (H) Cleaved DCP-1 immunofluorescence shows a neuronal apoptotic signal in repo>AmaRNAi. Dashed outlines show brain regions. Scale bars: 20 µm.

