
Fig. 6.
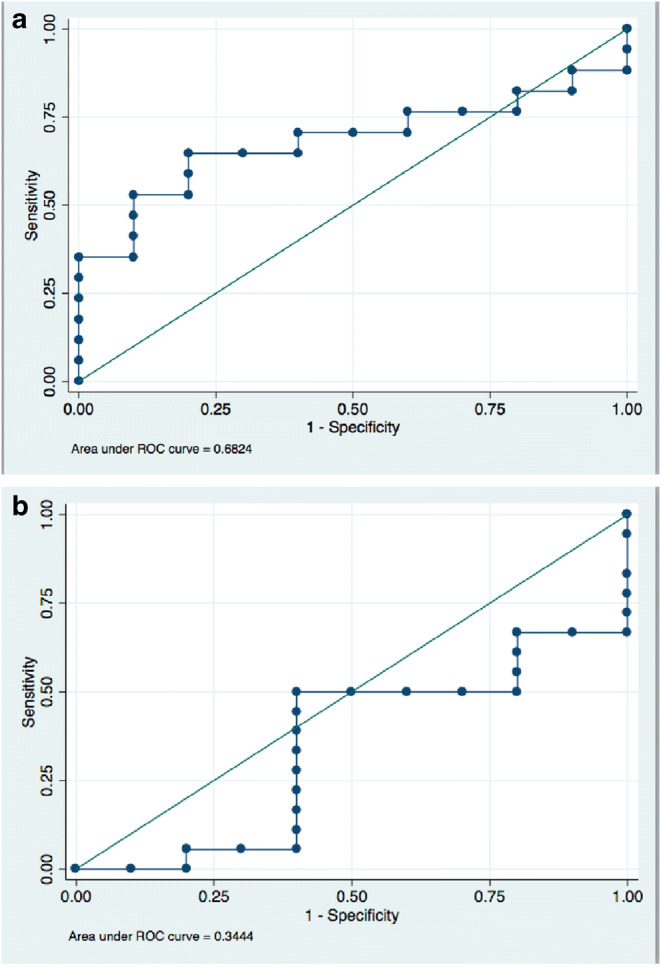
Receiver operating curve analysis to obtain optimal cutoffs for myoglobin (panel a) and high sensitivity troponin T (panel b) to assess diagnostic accuracy of these markers in mice with acute CVB3 myocarditis
Official websites use .gov
A
.gov website belongs to an official
government organization in the United States.
Secure .gov websites use HTTPS
A lock (
) or https:// means you've safely
connected to the .gov website. Share sensitive
information only on official, secure websites.
Receiver operating curve analysis to obtain optimal cutoffs for myoglobin (panel a) and high sensitivity troponin T (panel b) to assess diagnostic accuracy of these markers in mice with acute CVB3 myocarditis