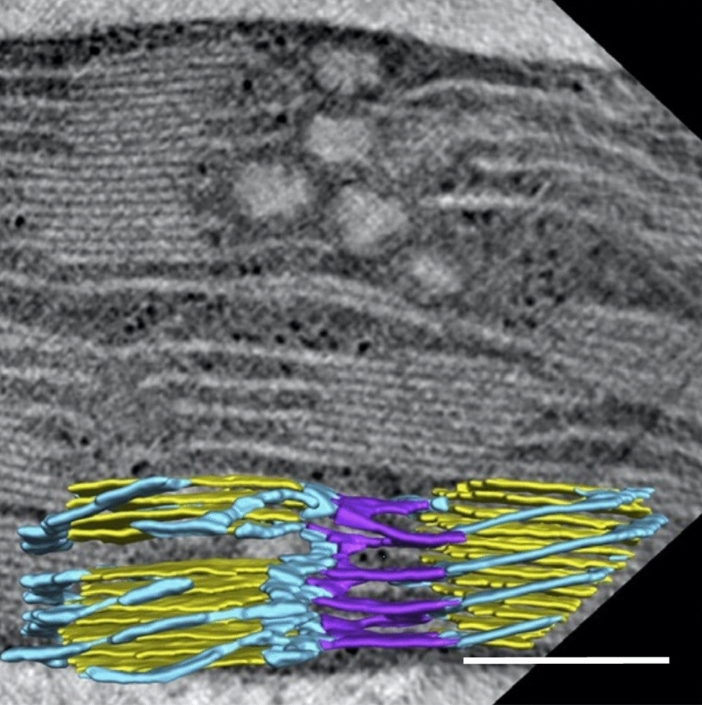
Fig. 12.
Electron tomography slice image of a lettuce chloroplast illustrating stacked grana thylakoids and non-stacked stroma thylakoids. Superimposed in the lower part of the micrograph is a 3D tomographic model that illustrates how two sub-groups of stroma thylakoids (blue, purple) bridge the space between two grana stacks (yellow). Thus, while the stroma thylakoids that form connections to the grana thylakoids are organized as right-handed helices (blue), those that connect the two sets of stroma thylakoids around the grana stacks are linked to each other through left-handed helices (purple). From Bussi et al. (2019). Bar 0.2 mm

