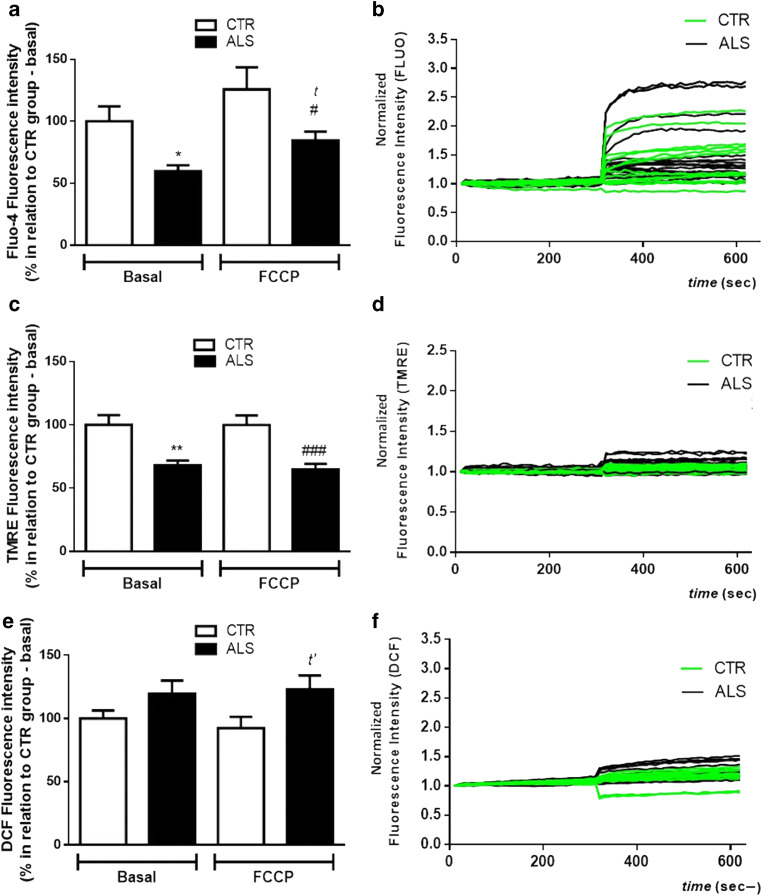
Fig. 1.
Mitochondrial depolarization and changes in calcium handling in PBMCs from ALS patients. PBMCs (300,000 cells/well—in a 96-well plate) were loaded with different fluorescent probes for 1 h at 37 °C before mitochondrial evaluation. a The histogram represents Fluo-4 fluorescence (10 μM) before and after stimulation with FCCP (5 μM). b Representative graphic line of normalized Fluo-4 fluorescence intensity in CTR/control (green lines) and ALS (black lines) samples. c Representative histogram of TMRE fluorescence (500 nM) before and after stimulation with FCCP (5 μM). d Representative graphic line of normalized TMRE fluorescence intensity of different samples in CTR/control (green lines) and ALS (black lines) samples. e The histogram represents the level of H2DCF-DA fluorescence (20 μM) before and after stimulation with FCCP (5 μM). f Representative graphic line of DCF normalized fluorescence intensity (values normalized to 1) in CTR/control (green lines) and ALS (black lines) samples. Data is represented by mean ± SD, and the results were normalized as a percentage of CTR/control group (basal fluorescence) (ALS group: N = 11; control group: N = 10, in duplicate). Statistical analysis was performed using one-way ANOVA followed by the post hoc Bonferroni and Student’s t test. It was considered significant when p < 0.05; *p < 0.05 and **p < 0.01, in relation control/CTR group (basal fluorescence); tp < 0.05, in relation to ALS group (basal fluorescence); t’p < 0.05, #p < 0.05, and ###p < 0.001, in relation control/CTR group in the presence of FCCP

